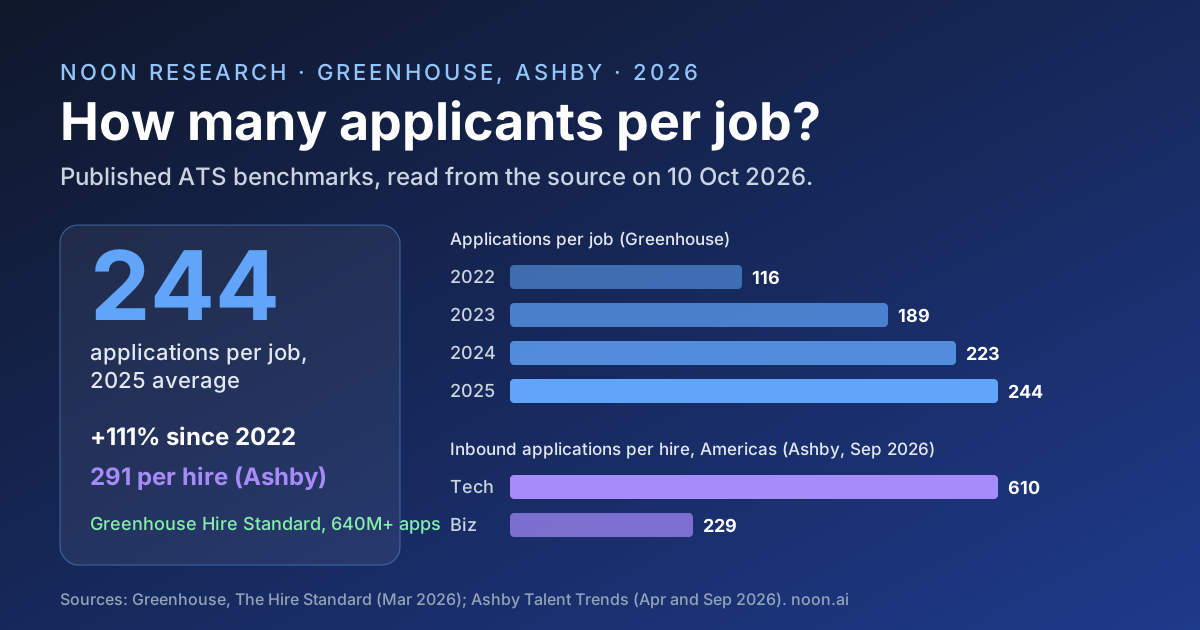
Key takeaway: The average job received 244 applications in 2025, according to Greenhouse's Hire Standard benchmark of more than 640 million applications across 6,000+ companies. That is 2.1 times the 116 of 2022 (Greenhouse reports +111%). Measured per hire rather than per job, the load is higher: Ashby found the average recruiter processing 291 applications per hire in data to March 2026, against roughly 100 in early 2021, and US technical roles drawing 610 inbound applications per hire.
"How many applicants does a job get" has a stock answer online: 250. That number comes from a Glassdoor blog post published in January 2015. The current data happens to land close to it, but for very different reasons, and the spread between roles, regions and definitions is now far wider than any single figure suggests.
This page sets out the primary benchmarks from two applicant tracking system vendors that publish their customer data, Greenhouse and Ashby, with every figure read from the source on 10 October 2026. None of it is Noon data.
How many applicants does a job posting get in 2026?
244 applications per job on average in 2025, per Greenhouse's Hire Standard report (March 2026), which analyzed data from over 6,000 companies and over 640 million applications from 2022 to 2025. Volume rose every year in the series, though the increase slowed to 21 applications (9.4%) in 2025.
| Year | Applications per job (Greenhouse) | Annual applications per recruiter | Recruiters per organization |
|---|---|---|---|
| 2022 | 116 | 1,610 | 10.43 |
| 2023 | 189 | 2,840 | 7.23 |
| 2024 | 223 | 3,930 | 5.44 |
| 2025 | 244 | 4,890 | 4.62 |
| Change 2022 to 2025 | +111% | +203.7% | -56% |
The right-hand columns explain why the number feels worse than it is. Each job draws about twice as many applications as in 2022, but each organization has fewer than half as many recruiters, so the annual pile per recruiter roughly tripled. Greenhouse's time-to-fill figure rose 37% over the same years, from 43.64 to 59.67.
Why do applicant benchmarks disagree?
Because they measure different things. Greenhouse itself publishes two figures that look contradictory: 244 applications per job in the Hire Standard, and 95 applications per job in 2025, up from 28 in 2021 (a 239% increase) in an October 2025 analysis of customer data pulled in August 2025. The two use different samples, windows and year ranges, so read each as a trend inside its own series rather than combining them.
| Benchmark | Figure | What it counts | Source date |
|---|---|---|---|
| Greenhouse Hire Standard | 244 applications per job (2025) | 640M+ applications, 6,000+ companies, 2022 to 2025 | March 2026 |
| Greenhouse customer data | 95 applications per job (2025) | Customer data pulled August 2025, 2021 to 2025 | October 2025 |
| Ashby Recruiter Productivity | 291 applications per hire | 109M+ applications, 247K jobs, January 2021 to March 2026 | April 2026 |
| Ashby EMEA vs AMER | 170 to 610 inbound applications per hire | 180K+ EMEA jobs, January 2021 to June 2026 | September 2026 |
| Glassdoor | 250 resumes per corporate opening | No dataset disclosed | January 2015 |
Per job and per hire also diverge whenever a requisition has several openings or closes without a hire. Per hire is the better planning number for a recruiter, since it states how much reading sits behind each filled seat.
How many applications does it take to make one hire?
291 applications per hire, per Ashby's Recruiter Productivity 2026 report (April 28, 2026). Ashby says applications per hire tripled from 2021 to 2024 and stayed above 300 throughout 2025, so the current figure reflects a slight easing from that peak, not a return to 2021 levels.
The same report shows the extra volume did not translate into proportionally more interviews or fewer hires. The average recruiter reached 7.3 hires per quarter by Q1 2026, and teams averaged 11.7 interviews per hire for business roles and 17.6 for technical roles. Most of the growth sits in the screening step before the first conversation, which is why screening calls and AI candidate screening have become the bottleneck teams try to fix first.
Do technical jobs get more applicants than business roles?
In the Americas, by a wide margin. Ashby's EMEA Recruiter Productivity report (September 9, 2026) splits inbound applications per hire by function and region:
| Role type | EMEA | AMER | AMER vs EMEA |
|---|---|---|---|
| Business roles | 170 | 229 | 34.7% more |
| Technical roles | 254 | 610 | 2.4 times |
A US technical requisition draws 2.66 times as many inbound applications per hire as a US business role (610 against 229). Ashby also reports that applications per hire in EMEA doubled from the start of 2021 to 2026, so the gap is between two rising series, not a calm European market.
When do most applications arrive?
In the first week. Ashby's Applications Per Job analysis found the first week of a posting "consistently 2-2.5x higher than following weeks", and recommends using the average of weeks two to four as the baseline for what a role will keep receiving. The same analysis, updated in February 2024, measured applications per business role up 3x (207%) and per technical role up 2.6x (161%) from January 2021 to January 2024. It counts direct applications only, not referrals or sourced candidates.
The practical consequence: whatever screening rules a team plans to use need to be live on the day the posting opens, because the largest batch lands before most teams have calibrated anything.
Do remote jobs get more applicants?
42% more, among startups. Ashby's State of Startup Hiring 2026 report (February 23, 2026), covering over 1,200 venture-backed startups, found remote startup jobs "received a material 42% more inbound applications than in-office startup jobs", a pattern it says held across startup sizes. For the share of US postings that offer remote or hybrid work in the first place, see our remote job statistics.
Where does the "250 applicants per job" figure come from?
From a Glassdoor blog post dated January 20, 2015: "On average, each corporate job opening attracts 250 résumés. Of these candidates, four to six will be called for an interview and only one will be offered a job." The post does not disclose a dataset, sample or method. Four to six interviews out of 250 is an interview rate of 1.6% to 2.4%.
The figure keeps circulating because it is round and quotable, and the 2025 Greenhouse average of 244 sits within 2.4% of it. Cite the dated benchmark instead: the 2015 number predates AI-assisted applying, and Greenhouse's own data shows applications per job more than doubling between 2022 and 2025.
Why are applications per job rising?
The sources name three drivers. Greenhouse's 2025 Workforce Report, cited in its pipeline-overload analysis, found more than one in five US candidates say they have used AI agents to apply for jobs automatically. Ashby points to tech layoffs pushing more candidates into the market and, in its global report, a rise in fraudulent applications. Our fake job applicant statistics and guide to detecting fake applicants for remote roles cover the fraud share in detail.
Fewer recruiters per team compounds all three. With 4.62 recruiters per organization in Greenhouse's 2025 data, each additional application lands on a smaller team, which feeds directly into time to hire and cost per hire.
What should recruiters do with these numbers?
- Plan capacity per hire, not per posting. At 229 to 610 applications per hire in the Americas, decide before posting how many applications a recruiter can read in full, and what happens to the rest.
- Front-load screening. The first week brings 2 to 2.5 times the volume of later weeks, so knockout questions and must-have criteria need to be live at launch. Our playbook for too many unqualified applicants per job posting walks through the steps.
- Rebalance toward outbound for technical roles. When a US technical role draws 610 inbound applications per hire, a smaller outbound sourcing pipeline of pre-qualified candidates is often a faster route to a shortlist than reading the whole queue.
The manual sift through inbound applications is one of the workflow pains recruiting teams raise most often in our evaluation calls. Noon's AI recruiting platform handles both sides of it. For inbound, it pulls applications from connected ATSes such as Greenhouse, Lever, Ashby and Workable several times a day, evaluates and ranks every one against the role's criteria and non-negotiables, flags likely fraud with the signals that triggered it, and syncs advance and reject decisions back to the ATS. For outbound, it sources across the whole web, not just LinkedIn, and contacts candidates by email and SMS. Noon has a single plan with unlimited sourcing, enrichment, contacts, agents and seats; see Noon pricing for details.
Methodology and sources
- Greenhouse, The Hire Standard (March 2026). Report preview page at greenhouse.com/recruiting-benchmarks, read on 10 October 2026: applications per job, applications per recruiter, recruiters per organization and time to fill for 2022 to 2025, from over 6,000 companies and over 640 million applications.
- Greenhouse, hiring pipeline overload (published October 2, 2025, updated September 15, 2026). Source of the 28 to 95 applications per job series (customer data pulled August 2025) and the Workforce Report AI-agent figure.
- Ashby Talent Trends reports. Recruiter Productivity 2026 (April 28, 2026; 109M+ applications, 247K jobs, January 2021 to March 2026), EMEA Recruiter Productivity (September 9, 2026; 180K+ EMEA jobs, January 2021 to June 2026), Applications Per Job (May 30, 2023, with a February 2024 update; about 14M applications) and The State of Startup Hiring 2026 (February 23, 2026; over 1,200 venture-backed startups).
- Glassdoor (January 20, 2015). Read rendered in a browser on 10 October 2026 because the page blocks plain HTTP clients.
Every figure on this page, with its exact source quote and fetch time, is recorded in our research file for this article. A script checks each quote against the saved page text and computes the derived numbers (the 2.1 multiple, the 9.4% 2025 increase, the 2.4 and 2.7 ratios, the 34.7% gap and the 1.6% to 2.4% interview rate).
Limitations
- Greenhouse and Ashby data come from their own customers, which skew toward technology and venture-backed companies with structured hiring. High-volume hourly roles posted on job boards without an ATS of this kind are not well represented.
- The two Greenhouse series (244 and 95 applications per job for 2025) use different samples and are not directly comparable. We report both rather than average them.
- Greenhouse figures here come from the public report preview; the full report may define metrics in more detail.
- Ashby's per-hire figures count only roles that produced a hire, and its Applications Per Job analysis excludes referrals and sourced candidates.
- The Glassdoor 250 figure has no published method and is shown only to date it.
FAQ
How many applicants does the average job get?
244 applications per job in 2025, per Greenhouse's Hire Standard benchmark of more than 640 million applications across 6,000+ companies. That compares with 116 in 2022, an increase of 111%.
How many applications does it take to make one hire?
Ashby's Recruiter Productivity 2026 report puts it at 291 applications per hire, against roughly 100 in early 2021. US technical roles average 610 inbound applications per hire and US business roles 229.
Is it true that every job gets 250 applicants?
The 250 figure comes from a Glassdoor blog post published in January 2015 with no disclosed method. Current data from Greenhouse (244 per job in 2025) happens to be close, but the spread by role and region runs from 170 to 610 applications per hire in Ashby's data.
Do remote jobs get more applications?
Yes, among startups. Ashby's 2026 startup hiring report found remote startup jobs received 42% more inbound applications than in-office startup jobs, consistently across startup sizes.
How many applications per job per week should I expect?
Ashby found the first week of a posting brings 2 to 2.5 times the applications of each following week. It recommends using the average of weeks two to four as the ongoing weekly baseline for a role.