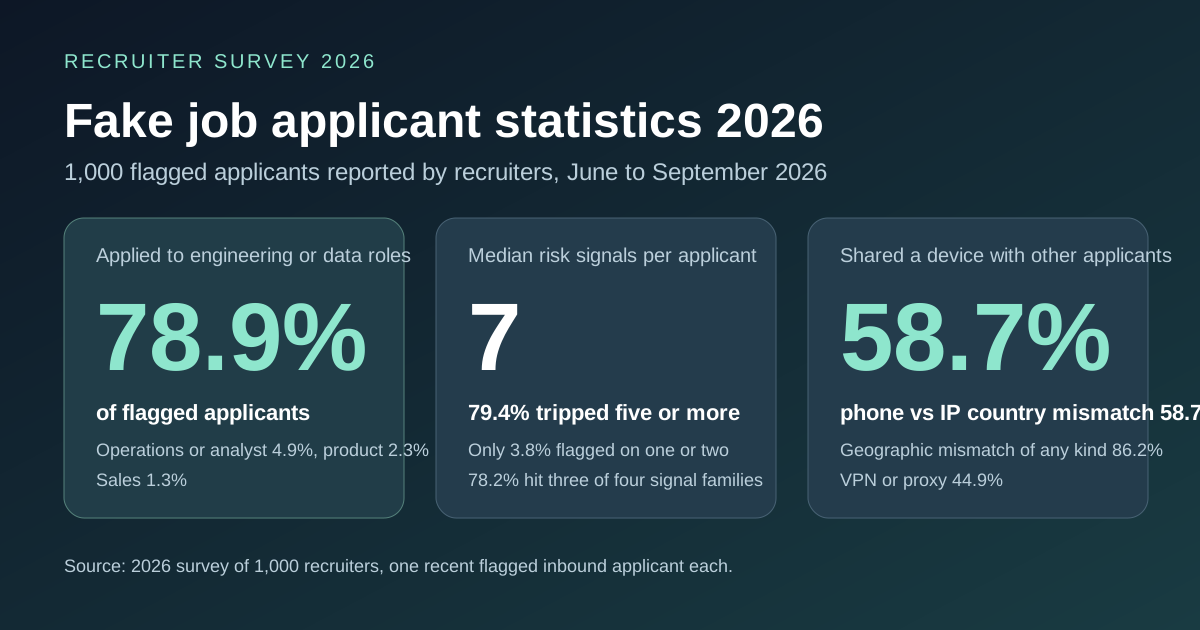
Key takeaway: 78.9% of job applicants flagged as suspicious in 2026 applied for engineering or data roles, and the median flagged applicant tripped 7 separate risk signals out of roughly 19 checks. In a 2026 survey of 1,000 recruiters who each reported one recent flagged applicant, the most common signals were a phone number registered to a different country than the applicant's IP (58.7%), the same device being used by multiple applicants (58.7%), a timezone that did not match the IP (58.1%), and almost no email footprint (55.6%). 44.9% were connecting through a VPN or proxy, and 86.2% showed at least one geographic mismatch. Only 3.8% were flagged on one or two signals; suspicious applicants look suspicious in several independent ways at once.
The FBI's Internet Crime Complaint Center warned on June 28, 2022 of an increase in complaints about deepfakes and stolen personally identifiable information being used to apply for remote positions, naming "information technology and computer programming, database, and software related job functions" (FBI IC3 PSA I-062822-PSA). This page quantifies what flagged applicants actually look like, from a 2026 survey of 1,000 recruiters in which each recruiter reported one recent inbound applicant that their screening process had flagged as suspicious between June and September 2026, with the role category applied for and which of 25 risk checks the applicant had failed. A flag is not proof of fraud; it is the point at which a recruiter decided an application needed verification before an interview. The eight qualitative red flags recruiters report are covered in the candidate fraud red flags guide; this page is the statistical companion.
Which roles do fake applicants target?
| Role category applied for | Share of 1,000 flagged applicants |
|---|---|
| Engineering or data | 78.9% |
| Other (10.1%) or unclassified (1.0%) | 11.1% |
| Operations or analyst | 4.9% |
| Product | 2.3% |
| Sales | 1.3% |
| Design, marketing, support, HR, finance | 1.5% combined |
Four in five flagged applicants were applying for software engineering, data engineering, data science or adjacent technical roles. That matches the job functions the FBI named in its remote-work impersonation warning. Because the survey has no unflagged comparison group, it cannot say that engineering inbound is flagged at a higher rate than other inbound, only that engineering roles make up most of what gets flagged. Most of the flagged volume in this data sits in engineering hiring.
What are the most common fake applicant red flags?
| Risk signal | Share of flagged applicants | Engineering or data (789) | Other roles (211) |
|---|---|---|---|
| Phone number country does not match IP country | 58.7% | 62.5% | 44.5% |
| Multiple applicants using the same device | 58.7% | 63.9% | 39.3% |
| Device timezone does not match IP | 58.1% | 59.4% | 53.1% |
| Low email footprint (address barely used elsewhere) | 55.6% | 51.8% | 69.7% |
| Suspicious user behavior on the application | 54.4% | 55.8% | 49.3% |
| Device clock timezone does not match IP (device-level check) | 46.9% | 51.8% | 28.4% |
| Account IP country does not match stated location | 46.2% | 49.6% | 33.6% |
| VoIP phone number | 43.3% | 48.0% | 25.6% |
| Stated location does not match observed location | 42.7% | 47.7% | 24.2% |
| Proxy detected | 29.6% | 26.7% | 40.3% |
| VPN detected | 28.5% | 27.9% | 30.8% |
| No online profiles found | 23.4% | 25.6% | 15.2% |
| Datacenter connection (not a residential IP) | 22.6% | 21.2% | 28.0% |
| Limited phone presence | 18.6% | 20.4% | 11.8% |
| Mail server accepts all addresses | 14.2% | 9.9% | 30.3% |
| LinkedIn is the only profile | 12.7% | 13.1% | 11.4% |
| Email does not match the name on the résumé | 12.6% | 7.9% | 30.3% |
| Cookies disabled | 11.8% | 13.3% | 6.2% |
| Harmful IP reputation | 9.2% | 9.5% | 8.1% |
| Known VPN provider | 9.1% | 7.9% | 13.7% |
| New email address | 8.9% | 9.5% | 6.6% |
| Suspicious open ports | 8.9% | 6.8% | 16.6% |
| High-risk browser | 7.8% | 4.1% | 21.8% |
| IP on spam blocklists | 7.2% | 8.1% | 3.8% |
| Automated browser or bot | 6.3% | 2.8% | 19.4% |
The profile differs by target role. Flagged engineering and data applicants are defined by geography and shared infrastructure: 63.9% shared a device with other applicants, 62.5% had a phone registered to a different country than their IP, 48.0% used a VoIP number. That pattern is consistent with one operator running several candidate identities from a location other than the one claimed. Flagged applicants to non-technical roles look more like automation: 19.4% were bots, 21.8% used a high-risk browser, 30.3% had an email that did not match the résumé name and 30.3% came from catch-all mail servers, a pattern more consistent with mass-apply scripts than with impersonation.
How many red flags does a fake applicant show?
| Risk signals tripped | Share of flagged applicants |
|---|---|
| 1 or 2 | 3.8% |
| 3 or 4 | 16.8% |
| 5 or more | 79.4% |
| Median | 7 |
| Mean | 6.96 |
Grouping 20 of the 25 checks into four families (the five IP and email reputation checks sit outside them) makes the pattern clearer:
| Signal family | Share showing at least one signal in the family |
|---|---|
| Device and behavior (shared device, bot, risky browser, cookies off, suspicious behavior) | 86.7% |
| Geographic mismatch (IP, phone, timezone, stated location) | 86.2% |
| Thin identity (low email footprint, no profiles, new email, VoIP, limited phone presence, LinkedIn-only, mismatched email) | 83.5% |
| Anonymized connection (VPN, proxy, datacenter) | 48.1% |
78.2% of flagged applicants showed signals in at least three of the four families, and 29.8% in all four. 53.7% combined a shared device with a geographic mismatch. The practical implication: a single signal, such as a VPN, is weak evidence on its own (28.5% of flagged applicants used one, and this survey cannot say how often legitimate applicants do), but three independent families agreeing is what the flagged population looks like.
Is applicant fraud increasing?
This survey cannot answer that. It asked each recruiter for a recent flagged applicant, so the month distribution (June 11.7%, July 20.0%, August 29.5%, September 38.8%) mostly reflects recency, not growth, and should not be read as a trend. Every one of the 1,000 reported applicants was flagged within the four months from June to September 2026.
What should hiring teams do about fake applicants?
- Screen engineering inbound hardest. 78.9% of flagged applicants targeted engineering and data roles.
- Require agreement across signal families, not a single flag. The flagged population shows a median of 7 signals across 3 or more families; a lone VPN or VoIP number is not enough to reject on.
- Check device sharing and phone-to-IP geography first. They are the two most common signals and the most specific to coordinated schemes.
- Treat catch-all email domains and name mismatches as the mass-apply signature. Each was three to four times as common in flagged non-technical applicants (30.3% against 9.9% and 7.9%).
- Verify before the technical interview, not after. The FBI warning describes impersonation during online interviews, so an identity check before the skills screen stops a proxy candidate earliest. The guide to detecting fake applicants for remote roles lays out a seven-step verification workflow.
Running 25 checks per applicant by hand is not realistic at inbound volumes. Noon builds fraud detection into every candidate evaluation. Every application it pulls from your ATS passes through the detection pipeline before a recruiter sees it: connection analysis for VPN, proxy and datacenter routing, the claimed location reconciled against observed timezone and geography, and the contact email checked for disposable domains. Each signal is weighed against the others, so a single anomaly is context while several together become one explainable risk flag. It is part of the same AI recruiting platform that sources and screens candidates, on one unlimited plan. The AI candidate screening guide covers where screening sits in the funnel, and the unqualified applicants per posting numbers show why manual review no longer scales.
Methodology
The data comes from a 2026 survey of 1,000 recruiters (external survey data). Each recruiter reported one recent inbound applicant (flagged between June and September 2026) that their screening process had marked as suspicious, with the month flagged, the category of role applied for, the number of checks their process ran (mean 18.9), and which of 25 standard risk signals the applicant tripped: five geographic mismatch checks, three connection anonymization checks, seven identity-footprint checks, five device and behavior checks, and five IP and email reputation checks. Shares are the number of flagged applicants showing a signal divided by 1,000. Signal families and the counts per applicant are computed from the same rows. All survey figures are produced by a committed script from the survey file. The FBI IC3 warning quoted above was fetched and read on 2026-10-10.
Limitations
This dataset describes applicants that were flagged, not applicants that were fraudulent, and it contains no unflagged comparison group, so it cannot say what share of all applicants are suspicious or how often any signal appears among legitimate candidates. Recruiters chose which flagged applicant to report, and different screening processes run different checks (mean 18.9 of 25), so a signal's absence may mean it was not checked. The role categories are self-reported. The non-technical group is 211 applicants, so its signal shares are less precise than the engineering group's.
FAQ
What percentage of fake job applicants apply to engineering roles? 78.9% of flagged applicants in this survey applied for engineering or data roles.
What are the most common signs of a fake job applicant? Phone number country not matching the IP (58.7%), several applicants sharing one device (58.7%), a timezone that does not match the IP (58.1%), and an email address with almost no footprint elsewhere (55.6%).
How many red flags does a suspicious applicant usually have? A median of 7 out of about 19 checks run. 79.4% showed five or more; only 3.8% were flagged on one or two.
Do fake applicants use VPNs? 28.5% of flagged applicants were on a VPN, 44.9% on a VPN or proxy, and 48.1% on a VPN, proxy or datacenter connection. A VPN alone is weak evidence; 86.2% showed a geographic mismatch, which is a stronger signal.
Are fake applicants bots? Mostly not for technical roles: 2.8% of flagged engineering applicants were automated browsers, against 19.4% of flagged applicants to other roles.
Is a flagged applicant the same as a fraudulent one? No. A flag means the application needed verification before an interview. This survey does not measure how many flags were confirmed as fraud.