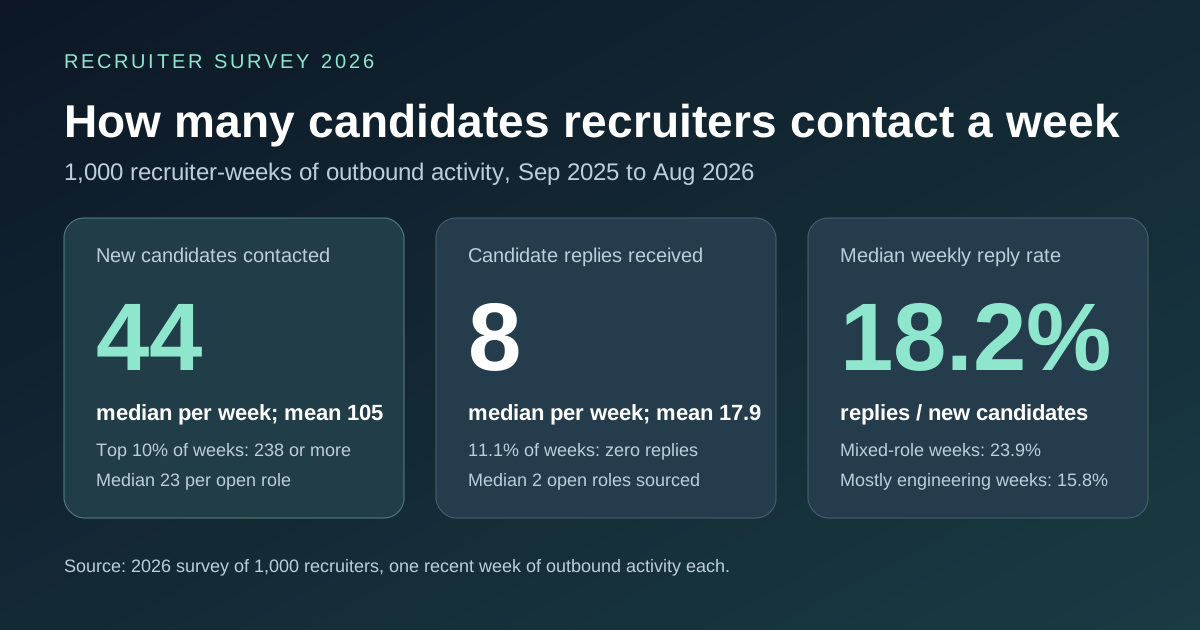
Key takeaway: In a typical week, the median recruiter contacts 44 new candidates, works 2 open roles, and receives 8 candidate replies, a median weekly reply rate of 18.2%. The distribution is very wide: a quarter of recruiter-weeks involve 16 or fewer new candidates, the top quarter 110 or more, and the top 10% 238 or more. Those figures come from a 2026 survey in which 1,000 recruiters each submitted one week of their outbound activity between September 2025 and August 2026. Weeks with a mix of engineering and non-engineering roles were the busiest (median 102 candidates) and also had the highest reply rate (23.9%); weeks spent mostly or entirely on engineering roles had the lowest (15.8%).
"How many candidates should a recruiter reach out to per week?" is asked constantly and answered with folklore. This page gives a measured distribution. A 2026 survey of 1,000 recruiters asked each to report one recent week of outbound sourcing activity: the week, the number of new candidates contacted for the first time, the number of roles they were actively sourcing for, the number of candidate replies received that week, and the share of their active roles that were engineering roles. The unit of analysis is the recruiter-week; each recruiter contributed one week.
The reply rate here is replies received in the week divided by new candidates contacted in the same week, which is a rougher measure than the per-email rates on the recruiter cold email response rate page, because some of the week's replies answer the previous week's emails. It lands in the same range: the median weekly rate below is 18.2%, against 17.6% of delivered cold emails getting a reply on that page.
How many new candidates does a recruiter contact per week?
| Percentile of recruiter-weeks | New candidates contacted |
|---|---|
| 10th | 6 |
| 25th | 16 |
| Median | 44.5 |
| 75th | 109.5 |
| 90th | 238 |
| Mean | 104.6 |
The mean (105) is more than double the median (44) because a minority of very high-volume weeks pull it up: 27.3% of recruiter-weeks involved more than 100 new candidates and 12.4% more than 200. At the other end, 52.7% of weeks involved fewer than 50. Anyone quoting an "average of 100 candidates a week" is describing the top third.
How many roles does a recruiter work at once?
| Measure | Open roles actively sourced |
|---|---|
| Median | 2 |
| 75th percentile | 3 |
| 90th percentile | 5 |
| Mean | 2.3 |
| Share of weeks with exactly 1 role | 47.8% |
| Share of weeks with 3 or more roles | 30.4% |
The median recruiter sourced for 2 roles in the reported week, and almost half worked a single role. Per role, the median recruiter contacted 23 new candidates per role per week.
How many replies does a recruiter get per week?
| Percentile of recruiter-weeks | Candidate replies received |
|---|---|
| 25th | 3 |
| Median | 8 |
| 75th | 21 |
| 90th | 44 |
| Mean | 17.9 |
11.1% of recruiter-weeks produced zero replies. The median weekly reply rate (replies divided by new candidates contacted) was 18.2%, with a mean of 22.1%. That is close to the 17.6% per-email reply rate on the recruiter cold email response rate page once you allow for replies to prior weeks' follow-ups landing in the current week; see the candidate response time page for how long replies take.
Does the role mix change the numbers?
| Share of active roles that are engineering | Recruiter-weeks | Median new candidates | Median replies | Median weekly reply rate |
|---|---|---|---|---|
| 0% (no engineering roles) | 671 | 37 | 7 | 19.4% |
| 1% to 50% (mixed) | 71 | 102 | 24 | 23.9% |
| 51% to 100% (mostly or all engineering) | 258 | 53.5 | 9 | 15.8% |
67.1% of recruiter-weeks involved no engineering roles and 17.9% were entirely engineering. Weeks spent mostly on engineering roles involved 45% more outreach than non-engineering weeks (53.5 vs 37 candidates) for a lower reply rate (15.8% vs 19.4%), which fits the finding on the software engineer response rate page that engineers mostly reply to a follow-up rather than the first email. The mixed weeks are the busiest and the most responsive, but they are only 71 of the 1,000 weeks, and the survey did not collect team size or tooling, so the reason for the gap is not measured.
Has weekly volume changed over the year?
| Period | Recruiter-weeks | Median new candidates | Median replies | Median weekly reply rate |
|---|---|---|---|---|
| Sep to Dec 2025 | 149 | 28 | 4 | 15.8% |
| Jan to Mar 2026 | 184 | 48.5 | 9 | 19.0% |
| Apr to Jun 2026 | 294 | 44 | 10 | 20.3% |
| Jul to Aug 2026 | 373 | 51 | 9 | 17.6% |
Weekly volume roughly doubled from late 2025 to 2026 and the reply rate rose with it, peaking in the second quarter. The later periods have more submitted weeks because recruiters were asked for a recent week, so the period comparison is directional.
What the numbers mean for capacity planning
- Benchmark against the median, not the mean. 44 new candidates and 8 replies a week is the midpoint; 100 a week is a top-third performance, and 238 is top-decile.
- Expect about 23 new candidates per open role per week. A recruiter carrying 4 roles at the median pace is at 90-plus contacts a week, which is where manual personalization breaks.
- Budget for engineering roles differently. They take more outreach per reply (15.8% weekly rate versus 19.4%).
- Zero-reply weeks happen to one recruiter in nine. They are a signal to check deliverability and sequence length before changing the pitch; the recruiting follow-up email benchmarks page shows how much reply volume depends on steps two to four.
The survey does not explain the gap between the median (44) and the top decile (238), but the arithmetic of item 2 is where most teams feel it: personalized outreach to 90 or more people a week is a large weekly workload on top of screening and scheduling. That is the work how to automate recruiting outreach covers. Noon's AI recruiting agents source candidates and run personalized email and SMS sequences on a single plan with unlimited seats and contacts, so contact volume is not capped by credits; see Noon pricing.
Methodology
The data comes from a 2026 survey of 1,000 recruiters. Each reported one recent week (week starting between 1 September 2025 and 31 August 2026) with the number of new candidates contacted for the first time that week, the number of roles actively sourced, the number of candidate replies received that week, and the percentage of active roles that were engineering roles. Each recruiter contributed one week, so the 1,000 rows are 1,000 recruiter-weeks. Percentiles are computed across recruiter-weeks. Weekly reply rate is replies received divided by new candidates contacted in the same week. All figures are produced by a committed script from the survey file.
Limitations
A recruiter-week is a snapshot and recruiters chose which week to report, which may skew toward busier or more typical weeks. Replies received in a week include replies to earlier weeks' emails, so the weekly reply rate is not the same as a per-email reply rate. "Candidates contacted" counts people, not emails, so it does not reflect follow-up volume. Period comparisons are directional because later months have more submissions. The survey did not collect team size, seniority of the recruiter, or agency versus in-house status, all of which likely explain much of the spread.
FAQ
How many candidates does the average recruiter contact per week? Median 44.5 new candidates per week; mean 104.6. A quarter of recruiter-weeks involve 16 or fewer and a quarter 110 or more.
How many open roles does a recruiter typically work? Median 2. 47.8% of recruiter-weeks involved a single role and 30.4% three or more.
How many replies does a recruiter get per week? Median 8, mean 17.9. 11.1% of weeks had no replies.
What is a good weekly reply rate for recruiter outreach? The median was 18.2% (replies in the week divided by new candidates contacted). Mixed engineering and non-engineering weeks ran at 23.9%, mostly or all-engineering weeks at 15.8%.
How many candidates should a recruiter contact per open role? The median was 23 new candidates per role per week.
Do engineering recruiters send more outreach? Yes. Weeks spent mostly on engineering roles involved a median of 53.5 new candidates against 37 for weeks with no engineering roles, with a lower reply rate.