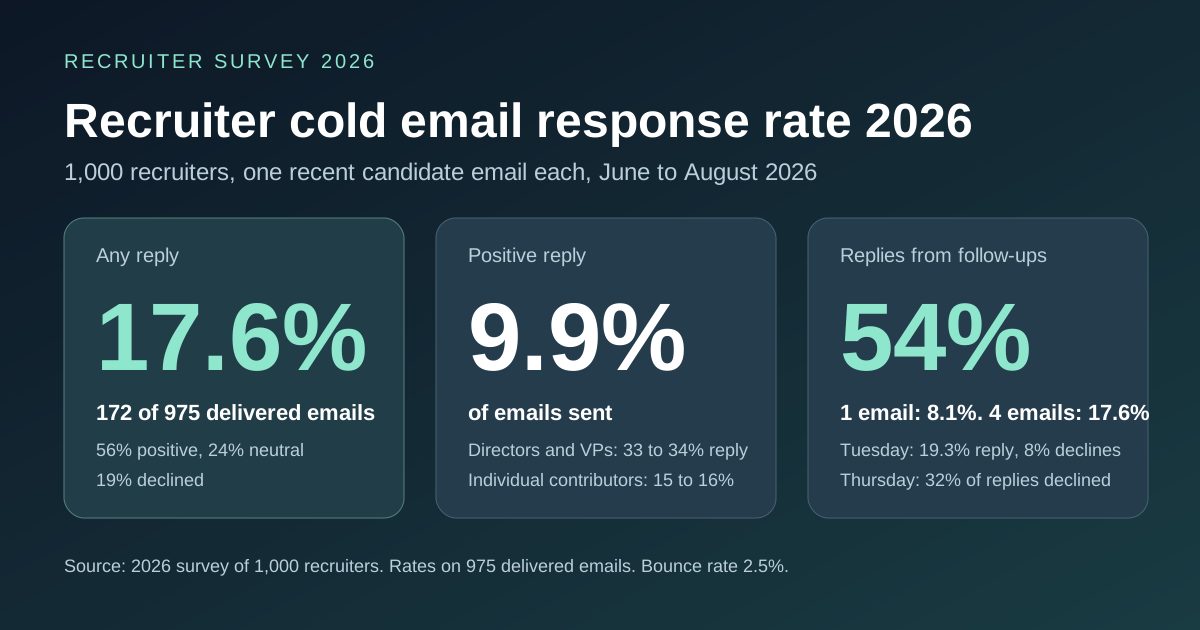
Key takeaway: 17.6% of recruiter cold emails get a reply, and 9.9% get a positive reply. That is the result of a 2026 survey in which 1,000 recruiters each submitted one recent outbound candidate email with its outcome. Of the 975 emails that were delivered, 172 drew a response: 56% of those replies were positive, 24% neutral and 19% negative. The rate is not fixed: Directors and VPs replied at 33-34%, individual contributors at 15-16%, and a four-step sequence more than doubled the single-email rate (8.1% to 17.6%).
Recruiters quote reply rates from memory, from a vendor dashboard, or from a sales benchmark that was never about candidates. This page gives one number from one method: in 2026 we surveyed 1,000 recruiters and asked each for a single recent cold email to a candidate, sent between 1 June and 31 August 2026, with the candidate's title and seniority, the send day, delivery status, and whether, when and how the candidate replied.
The emails covered eleven role families, from software engineering and sales to nursing and law, and six seniority levels. 25 of the 1,000 bounced (a 2.5% bounce rate); every rate below is calculated on the 975 delivered emails. Companion pages break out software engineers, response time and seniority in more detail.
What is the average response rate to recruiter cold emails?
17.6%, counting any reply. The positive reply rate, the number most teams actually care about, is 9.9%. Roughly one delivered email in six gets an answer, and one in ten gets a candidate who wants to talk.
| Outcome (975 delivered emails) | Count | Rate per email sent | Share of replies |
|---|---|---|---|
| Any reply | 172 | 17.6% | 100% |
| Positive reply (interested) | 97 | 9.9% | 56.4% |
| Neutral reply (questions, "not now") | 42 | 4.3% | 24.4% |
| Negative reply (declined) | 33 | 3.4% | 19.2% |
| No reply | 803 | 82.4% | - |
Two points for anyone setting targets. First, a negative reply is rare: only 3.4% of emails produced a "no", so most of the silence is silence, not rejection. Second, a positive-reply share of 56% means the quality of the list matters at least as much as the copy; more than half of the people who answered were open to the role.
How does the reply rate vary by role?
| Candidate role family | Emails | Reply rate | Positive reply rate | Negative share of replies |
|---|---|---|---|---|
| Marketing | 49 | 34.7% | 18.4% | 29.4% |
| Product Manager | 45 | 26.7% | 15.6% | 8.3% |
| Finance | 27 | 22.2% | 14.8% | 0.0% |
| Operations | 56 | 19.6% | 10.7% | 27.3% |
| Accountant | 49 | 18.4% | 4.1% | 44.4% |
| Engineering Manager | 44 | 18.2% | 11.4% | 12.5% |
| Solutions Engineer | 142 | 16.9% | 11.3% | 16.7% |
| Software Engineer | 172 | 16.9% | 8.7% | 20.7% |
| Lawyer | 49 | 16.3% | 8.2% | 25.0% |
| Sales | 217 | 16.1% | 9.2% | 11.4% |
| Clinical Healthcare (nurses) | 125 | 10.4% | 7.2% | 23.1% |
Marketers were the most responsive group in the survey, at more than three times the reply rate of clinical healthcare candidates. Software engineers, the role recruiters most often describe as unreachable, replied at 16.9%, within a point of the all-role average and almost identical to sales candidates. Accountants replied often but rarely with interest: 44% of their replies were a decline and only 4.1% of accountant emails produced a positive answer. Role groups under 50 emails (Finance, Product Manager, Marketing, Accountant, Lawyer, Engineering Manager) are directional.
How does seniority change the reply rate?
| Seniority | Emails | Reply rate | Positive reply rate |
|---|---|---|---|
| Individual contributor | 443 | 15.8% | 8.4% |
| Senior individual contributor | 244 | 15.2% | 8.6% |
| Manager | 142 | 13.4% | 8.5% |
| Director | 82 | 32.9% | 17.1% |
| VP | 44 | 34.1% | 25.0% |
| C-level | 20 | 20.0% | 10.0% |
Directors and VPs replied at roughly twice the rate of individual contributors, and one VP in four replied positively. Yet only 14.6% of the surveyed emails went to Director-level or above. The full breakdown, including who says no most often, is in candidate reply rates by seniority.
How much do follow-ups add to the response rate?
More than the first email does. Only 79 of the 172 replies (45.9%) came in response to the initial email. The other 54.1% were replies to a follow-up.
| Sequence step | Replies | Share of all replies | Cumulative reply rate |
|---|---|---|---|
| Initial email | 79 | 45.9% | 8.1% |
| Follow-up 1 | 37 | 21.5% | 11.9% |
| Follow-up 2 | 25 | 14.5% | 14.5% |
| Follow-up 3 | 31 | 18.0% | 17.6% |
A recruiter who sends one email and stops should expect about an 8% reply rate. The same email with three follow-ups reaches 17.6%, 2.2 times as many conversations. Follow-ups did not noticeably increase rejections: the negative share of replies was 16.5% on the initial email and 12-27% on the follow-ups. For cadence and spacing see our recruiting follow-up benchmarks and cold recruiting outreach templates.
Does the send day matter?
A little for volume, a lot for tone.
| Send day | Emails | Reply rate | Positive reply rate | Negative share of replies |
|---|---|---|---|---|
| Monday | 188 | 17.0% | 9.6% | 21.9% |
| Tuesday | 192 | 19.3% | 12.0% | 8.1% |
| Wednesday | 192 | 18.8% | 8.9% | 19.4% |
| Thursday | 184 | 16.8% | 8.2% | 32.3% |
| Friday | 150 | 18.0% | 12.0% | 18.5% |
| Saturday | 32 | 12.5% | 9.4% | 25.0% |
| Sunday | 37 | 13.5% | 8.1% | 0.0% |
Tuesday had the highest reply rate and the lowest share of negative replies (8.1%). Thursday had the highest share of rejections, 32.3% of replies. Weekend sends (7% of the survey) replied at 13.0% against 18.0% on weekdays. Engineers follow a slightly different pattern, covered in the best day to email software engineers.
How fast do candidates reply?
39.0% of replies arrived within 24 hours and 79.1% within seven days; the median reply took 2.1 days. The remaining 21% arrived later than a week, almost always in response to the third follow-up. Timing by role and by sequence step is in candidate response time to recruiter emails.
What does this mean for a recruiting team?
- Budget for a 17-18% reply rate and a 10% positive rate on a reasonably targeted list. A team that sees 8% is probably sending one email per candidate.
- Send the full sequence. Half of the replies in the survey came from follow-ups, and the third follow-up alone produced 18% of them.
- Reach higher in the org chart when the role allows. Directors and VPs answered twice as often as individual contributors.
- Watch the negative share by day. Thursday emails drew four times the rejection share of Tuesday emails in this survey.
At Noon, the AI outreach agent runs personalized email and SMS sequences automatically, so every candidate gets the full follow-up curve and the recruiter only steps in when someone replies. Everything is included in one plan with unlimited contacts and seats.
Methodology
In 2026 we surveyed 1,000 recruiters. Each submitted one recent outbound cold email to a candidate, sent between 1 June and 31 August 2026, with the following fields: send date and weekday, candidate role family and title, candidate seniority, delivery status, whether the candidate replied, the reply sentiment (positive, neutral or negative, as classified by the recruiter), which message in the sequence the candidate replied to (initial email or follow-up 1, 2 or 3), and days from the initial email to the reply. 25 emails bounced and are excluded from reply rates, which are computed on the 975 delivered emails. Every figure on this page is produced by the committed script seo/research/stats/recruiter-outreach-survey-2026/compute.py against the survey dataset.
Limitations
One email per recruiter means the survey measures a cross-section of outreach, not any one team's performance. Role groups below 50 emails and seniority groups below 50 emails (VP, C-level) should be read as directional. Sentiment was classified by the submitting recruiter, not by a shared rubric. The window is a single summer quarter; seasonal effects are not measured.
FAQ
What is a good response rate for recruiter cold emails? The survey average was 17.6% for any reply and 9.9% for a positive reply on delivered emails. A sequence of four messages is what produced that number; a single email produced 8.1%.
What percentage of candidates reply positively to recruiters? 9.9% of delivered emails got a positive reply. Among candidates who replied, 56.4% were positive, 24.4% neutral and 19.2% negative.
Do software engineers reply to recruiter emails less than other candidates? Not in this survey. Software engineers replied to 16.9% of emails, against a 17.6% all-role average and 16.1% for sales candidates. See the software engineer response rate breakdown.
How many recruiter emails bounce? 2.5% of the 1,000 surveyed emails bounced. Engineering roles bounced slightly more often (3.2%) than non-engineering roles (2.1%). See recruiting email deliverability for how to keep that number down.
Does the day of the week change the reply rate? Tuesday emails had the highest reply rate (19.3%) and the lowest negative share (8.1%). Weekend emails replied at 13.0% versus 18.0% on weekdays.