Key takeaway: Predictive hiring analytics uses four model types: pipeline velocity, candidate conversion, quality-of-hire prediction, and demand forecasting. Any of them needs a benchmark to predict against, and the 2026 numbers moved: median time-to-fill for nonexecutive roles fell to 39 days from 44 in 2025, the most effective recruiting organizations run about five days faster than the median, and extra-large employers absorbed a 67% increase in requisitions per recruiter (SHRM 2026 recruiting benchmarking). You do not need a data science team to start, but you do need connected data and an honest baseline.
Most recruiting teams operate in hindsight. They know last quarter's time-to-fill. They know the engineering team's offer acceptance rate. They know three hires from Q1 did not make it past their sixth month. This is descriptive analytics, a rearview mirror view of what already happened.
Predictive hiring analytics points the other direction. Instead of reporting what happened, it forecasts what will happen. Which open requisitions are likely to slip past 60 days. Which candidates in the pipeline will probably accept an offer. Which new hires from the last cohort will be top performers a year from now. Which roles will need to be filled next quarter based on attrition patterns.
The gap between knowing what happened and knowing what will happen is enormous. LinkedIn's 2025 Future of Recruiting report found that 89% of talent acquisition leaders say measuring quality of hire is increasingly critical, while only 25% feel confident their organization can actually do it. Adoption of generative AI inside HR functions has climbed steeply over the same period, per Gartner's HR research. The technology is ready. The challenge is knowing how to apply it.
This guide covers the four types of predictions that modern recruiting analytics can produce, the data infrastructure required to support them, and a practical implementation roadmap that does not require a dedicated data science team.
What benchmarks should your models predict against in 2026?
A prediction is only useful relative to a target, and the targets shifted this year. Refresh these before you calibrate anything.
| Benchmark | 2026 value | Change from 2025 | Source |
|---|---|---|---|
| Median time-to-fill, nonexecutive roles | 39 days | Down from 44 days | SHRM 2026 recruiting benchmarking |
| Gap for most effective recruiting orgs | About 5 days faster than median | Newly reported | SHRM 2026 |
| Requisitions per recruiter, extra-large orgs | Up 67% | Sharp increase | SHRM 2026 |
| US job postings index (Feb 2020 = 100) | 101.0 at 30 June 2026, -3.7% year over year | Still declining, but decelerating | Indeed Hiring Lab, 23 July 2026 |
| US software development postings | Up almost 15% since late February 2025, 71% of growth from senior roles | Reversal after years of contraction | Indeed Hiring Lab, 8 July 2026 |
If you want the underlying mechanics rather than the benchmarks, our guide to machine learning in recruitment covers how these models are trained, and hiring velocity covers instrumenting the inputs.
Two practical implications. First, a pipeline-velocity model trained on 2024 and 2025 cycles will systematically under-predict urgency, because the market median got five days faster. Second, caseload matters as much as market conditions: if requisitions per recruiter jumped while your model treats recruiter capacity as constant, its stall predictions will be optimistic in exactly the quarters you need them to be right.
What does the analytics maturity curve look like in recruiting?
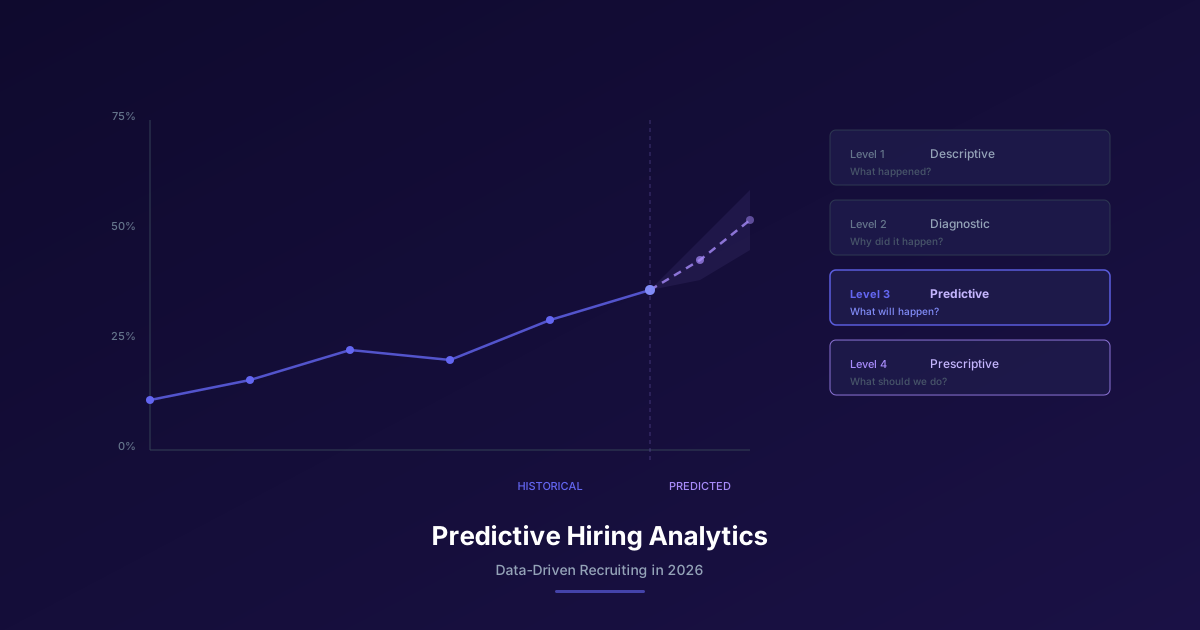
Before diving into predictive models, it helps to understand where most teams sit on the analytics maturity curve:
Level 1: Descriptive, What happened? Reports on time-to-fill, cost-per-hire, source-of-hire, offer acceptance rates. This is where 70-80% of recruiting teams operate. The data is useful but backward-looking.
Level 2: Diagnostic, Why did it happen? Correlating outcomes with causes. Why did time-to-fill increase for engineering roles? Because the compensation band wasn't competitive. Why did offer acceptance drop? Because the interview process added a fourth round. Most teams that have invested in analytics operate here.
Level 3: Predictive, What will happen? Forecasting future outcomes based on patterns in historical data. Which roles will take longer than 60 days? Which candidates are most likely to accept? Which hires will succeed? This is where most teams aspire to be but few actually are.
Level 4: Prescriptive, What should we do about it? Automated recommendations based on predictions. The system doesn't just tell you a req will slip, it suggests adjusting the compensation band, expanding the geographic search, or activating passive sourcing because the active candidate pool is too thin. This is the frontier.
What are the four predictions that matter most in recruiting?
Prediction 1: Pipeline velocity, Which roles will stall?
The most immediately actionable prediction: identifying which open requisitions will likely exceed your target time-to-fill before they actually stall.
Input data:
- Historical time-to-fill for similar roles (same function, level, location, compensation band)
- Current pipeline depth and stage distribution
- Sourcing channel mix and historical channel effectiveness
- Hiring manager responsiveness (time from candidate submission to feedback)
- Market supply indicators (how many qualified candidates exist in the relevant talent pool)
How the model works: The system builds a regression model that predicts time-to-fill based on these features. When a new req is opened, the model estimates its likely trajectory. If the prediction exceeds the target, say, 45 days when the goal is 35, the system flags it early.
More sophisticated versions update the prediction daily as new data arrives. A role that started with a healthy pipeline but hasn't gotten hiring manager feedback in 10 days will see its predicted time-to-fill increase.
Why it matters: The difference between flagging a stalling req at day 10 versus day 40 is the difference between a mid-course correction and a failed search. Early warnings let TA leaders reallocate sourcing resources, have compensation conversations with hiring managers, or activate additional channels before the req becomes urgent.
Prediction 2: Candidate conversion, Who will accept?
Predicting which candidates in your pipeline will ultimately accept an offer is valuable for pipeline management and resource allocation.
Input data:
- Candidate engagement signals (response time to messages, number of touchpoints, questions asked)
- Competitive situation indicators (are they interviewing elsewhere, what's their current tenure)
- Compensation alignment (is the band competitive with their current compensation and market rates)
- Interview feedback patterns (how they performed across each stage)
- Historical patterns for similar candidates (same function, level, industry background)
How the model works: Classification models (logistic regression, gradient boosting, or neural networks) trained on historical pipeline data predict the probability that a candidate at a given stage will eventually accept an offer. The model outputs a probability score, "this candidate has a 73% likelihood of accepting", that updates as new signals arrive.
Why it matters: When you know that three of your five finalists have high acceptance probability and two have low, you can focus your closing efforts and identify where you need backup candidates. It also helps forecast hiring volume, if you have 20 candidates in final rounds with an average predicted acceptance rate of 65%, you can expect approximately 13 hires.
Prediction 3: Quality of hire, Who will succeed?
This is the hardest prediction and the one with the highest potential value. Forecasting which candidates will perform well after being hired.
Input data:
- Pre-hire assessment scores (skills tests, cognitive assessments, structured interview ratings)
- Career trajectory features (rate of progression, tenure patterns, industry transitions)
- Role-fit signals (how closely their experience maps to the role requirements)
- Cultural alignment indicators (interview feedback on values alignment, work style fit)
- Post-hire outcomes from historical hires (performance ratings, promotion rates, retention at 12 and 24 months)
How the model works: The model connects pre-hire data with post-hire outcomes. It learns which pre-hire signals predict 12-month performance ratings, which predict retention, and which predict promotion. Then it applies those learned patterns to current candidates.
The critical requirement: a feedback loop connecting recruiting data with HRIS and performance management data. Without post-hire outcome data, there's nothing to predict against.
Why it matters: The Sackett et al. (2022) meta-analysis in the Journal of Applied Psychology, which recorrected decades of selection-validity estimates, found structured interviews predict job performance at r = 0.42 against r = 0.20 for unstructured interviews. A predictive model trained on actual outcomes can potentially exceed both by combining multiple signals, assessment scores, interview ratings, career trajectory, and role-fit analysis, into a single prediction.
The practical impact is about failed hires avoided. Widely cited early-tenure failure research (Leadership IQ's hiring study, published 2005) put the share of new hires failing within 18 months at 46%. That figure is old enough to treat as context rather than a current benchmark, so measure your own 12-month and 18-month involuntary exit rate first. Whatever the baseline, moving it by a few points is where the return on this work sits, because each avoided failed hire saves a full replacement cycle at the 2026 median of 39 days plus lost ramp time.
Prediction 4: Demand forecasting, What roles will open next?
Predicting which roles will need to be filled before they're officially opened.
Input data:
- Historical attrition patterns by team, function, and tenure
- Business growth indicators (revenue growth, customer acquisition, product roadmap milestones)
- Seasonal hiring patterns
- Internal mobility data (promotions, transfers, team changes)
- Industry benchmarks for turnover rates by function and level
How the model works: Time-series models analyze historical patterns to forecast future hiring needs. If the sales team has historically experienced 22% annual attrition, and current tenure data suggests a cluster of departures is likely in Q3, the system can flag the need to start sourcing sales candidates in Q2.
Why it matters: Reactive hiring, waiting until a role opens to start sourcing, guarantees at least 30-45 days of vacancy. Predictive demand forecasting lets teams build pipelines before roles open, reducing time-to-fill by the entire sourcing phase. The size of that gain depends entirely on how much of your time-to-fill is sourcing rather than interviewing, so measure your own sourcing-phase duration before assuming a number. Any vendor quoting a fixed percentage improvement here is quoting a marketing figure, not a benchmark.
What data infrastructure do you need for predictive hiring?
The reason most teams aren't doing predictive analytics isn't a technology problem. It's a data problem.
What you need
Connected systems: Your ATS, CRM, sourcing tools, HRIS, and performance management system need to share data. The candidate who entered your pipeline as an applicant needs to be trackable through hire, onboarding, performance reviews, and retention.
Consistent data entry: Predictions are only as good as the data they're trained on. If recruiters use different stage names, skip notes, or don't log sourcing channels consistently, the model has garbage to train on.
Historical volume: Most predictive models need at least 200-500 completed hiring cycles to produce reliable predictions. For quality-of-hire predictions, you need 12-24 months of post-hire outcome data. Companies that hire fewer than 50 people per year may not have enough data for robust predictions.
A feedback loop: The model needs to know when it was right and when it was wrong. If it predicted a candidate had a 90% acceptance probability and they declined, that signal needs to feed back into the model.
What most teams actually have
Disconnected systems with inconsistent data. The ATS holds recruiting data. The HRIS holds employee data. Performance management lives in a third system. Nothing is connected, so the complete candidate-to-employee journey is invisible.
This is why most recruiting teams are stuck at Level 1 or 2 on the maturity curve.
How does Noon approach predictive analytics differently?
Most predictive analytics in recruiting requires building infrastructure, connecting systems, cleaning data, training models, and maintaining pipelines. It's a multi-quarter project that requires data engineering resources most TA teams don't have.
Noon takes a different approach by embedding prediction directly into the recruiting workflow:
Evaluation inside the sourcing loop: Every candidate Noon surfaces is evaluated against role-specific criteria, including non-negotiables the system never relaxes, rather than keyword-matched against the job description. The evaluation is part of sourcing rather than a separate scoring dashboard.
Feedback-driven calibration: Thumbs-up and thumbs-down feedback from the hiring manager recalibrates the model for that role, and changing the criteria re-evaluates the existing pipeline rather than starting over. Non-negotiable criteria are enforced and never relaxed, so calibration tunes the judgment calls without loosening the hard requirements.
Multi-channel outreach in the same system: Personalized email and SMS outreach runs from the same platform that sourced the candidate, with unlimited email enrichment, so engagement data and sourcing data are not split across tools.
Outreach data in the same place: See our roundup of AI candidate outreach platforms for how this compares with bolting a sequencing tool onto a search product.
Continuous sourcing plus analytics: Sourcing runs continuously rather than in campaign bursts, and platform analytics report on pipeline and outreach performance, which gives you the current-state view most homegrown dashboards are built to produce.
The practical difference: the evaluation happens inside the workflow rather than in a separate tool a recruiter has to check. The system does not produce a report telling you which candidates to contact, it contacts them, and sourcing keeps running while you work the shortlist. That does not replace a forecasting model, but it removes the reason most teams wanted one, which was knowing where pipeline was thin. If you want to see how workflow-integrated prediction compares to building your own analytics stack, you can book a demo to review how pipeline depth and engagement signals show up inside the sourcing interface.
What's a practical 5-step roadmap for implementing predictive hiring?
For teams that want to move toward predictive analytics without a six-month infrastructure project:
Step 1: Audit your data (Week 1-2) Map what data exists across your ATS, HRIS, and any other systems. Identify gaps. The most common gaps: no connection between recruiting data and post-hire outcomes, inconsistent stage definitions across recruiters, and missing sourcing channel attribution.
Step 2: Clean and connect (Week 3-6) Standardize stage names, enforce required fields, and build basic integrations. Even a manual quarterly export from your HRIS into a spreadsheet, matched against recruiting data by candidate ID, creates the feedback loop needed for quality-of-hire analysis.
Step 3: Start with descriptive, but measure forward-looking indicators (Week 4-8) Before building predictive models, start tracking the input metrics that predictions will be based on: pipeline depth by stage, days-in-stage by role type, sourcing channel conversion rates, and hiring manager response times.
Step 4: Deploy a single prediction (Month 3) Pick the prediction with the highest impact-to-effort ratio. For most teams, that's pipeline velocity, predicting which roles will stall. It requires only ATS data, delivers immediately actionable insights, and doesn't need post-hire outcome data.
Step 5: Expand and automate (Month 4-6) Add conversion prediction, then quality-of-hire prediction as post-hire data becomes available. Automate alerts so predictions trigger actions (slack notifications for stalling reqs, auto-activated sourcing for predicted attrition).
Whichever route you take, keep the four benchmarks at the top of this article as the yardstick, and revisit them annually, because in 2026 they moved.
FAQ
What is predictive hiring analytics? Predictive hiring analytics uses statistical models and machine learning to forecast recruiting outcomes before they happen, which roles will stall, which candidates will accept offers, which hires will succeed, and where future hiring demand will emerge. It sits at Level 3 on the analytics maturity curve, above descriptive (what happened) and diagnostic (why it happened).
How accurate are predictive hiring models? Accuracy depends on data quality and volume. The Sackett et al. (2022) meta-analysis in the Journal of Applied Psychology found structured interviews predict job performance at r = 0.42 against r = 0.20 for unstructured interviews. Multi-signal models that combine assessment scores, interview data, and career trajectory can in principle exceed that by integrating more signal, but vendor-reported improvement percentages are marketing claims rather than peer-reviewed results. Insist on a holdout comparison against your own historical hires before believing any number.
What time-to-fill should our models target in 2026? Start from 39 days, the 2026 median for nonexecutive roles, and treat about 34 days as the effective-organization benchmark, since the most effective recruiting functions run roughly five days faster than the median (SHRM 2026 recruiting benchmarking). Then adjust by role family: senior software roles are competing in the one segment where postings grew this year (Indeed Hiring Lab, 8 July 2026).
Do predictive models still work when the market is flat? Yes, but retrain them. Indeed's Job Postings Index was 101.0 on 30 June 2026, down 3.7% year over year, with wide variation by sector (Indeed Hiring Lab, 23 July 2026). Models trained on 2021 and 2022 supply conditions misprice candidate scarcity in both directions.
Do I need a data science team for predictive hiring analytics? For building custom models from scratch, yes, you need data engineering and ML expertise. For using predictive features built into recruiting platforms, no. Platforms like Noon embed prediction into the workflow (matching quality, response likelihood, outreach optimization) without requiring data science resources. The trade-off: custom models can be tailored to your specific patterns, but platform-embedded predictions are immediately available.
What data do I need for predictive recruiting analytics? At minimum: ATS data (pipeline stages, sourcing channels, time-in-stage, outcomes) with at least 200+ completed hiring cycles. For quality-of-hire prediction: post-hire outcome data (performance ratings, retention, promotion) connected to recruiting data. For demand forecasting: historical attrition data by team and function. The biggest blocker for most organizations is connecting recruiting data with post-hire HR data.
How does predictive analytics differ from AI recruiting? Predictive analytics forecasts outcomes. AI recruiting automates actions. They're complementary. A predictive model might forecast that a role will stall in 45 days. An AI recruiting agent responds by activating additional sourcing channels, expanding the search criteria, and sending personalized outreach to passive candidates. The most effective systems, like Noon, combine both: predictions that inform actions, and actions that generate data for better predictions.