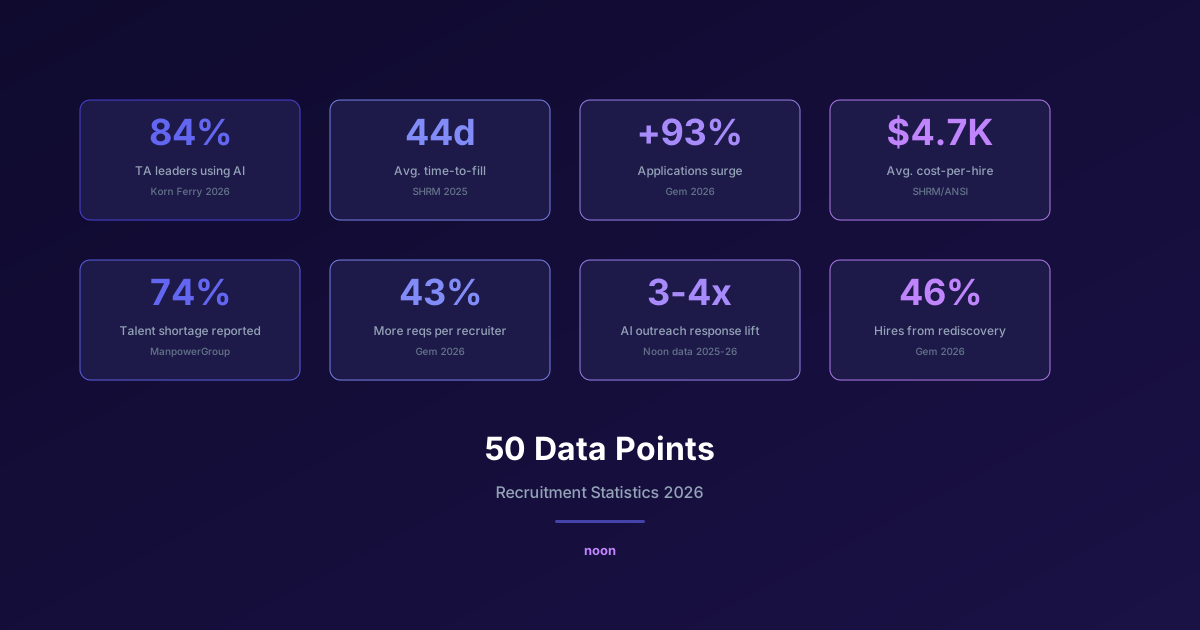
Key takeaway: 50 verified recruitment statistics for 2026: median time-to-fill is 44 days, average cost-per-hire is $4,700, 74% of employers face talent shortages, 84% of talent leaders plan to use AI in recruiting, and AI-personalized outreach gets 3-4x higher response rates than template-based campaigns. Every number in this article is sourced from primary research (SHRM, Gartner, LinkedIn, ManpowerGroup) so you can cite them with confidence.
Every recruiting presentation needs data. The problem is that most "recruiting statistics" articles recycle the same unverified numbers, cite vendor marketing as research, or reference studies from 2019 as if they're still relevant.
This article compiles 50 recruitment statistics for 2026 — each sourced from primary research institutions, canonical benchmark reports, or government labor data. Where a number comes from a vendor report, the methodology is noted so you can assess its reliability.
Use this as a reference, not a read-through. Bookmark it for when your CFO asks about cost-per-hire benchmarks, your CHRO wants AI adoption data, or you need to justify a tool investment with hard numbers.
What do the numbers say about hiring market demand?
1. U.S. job openings averaged 7.6 million per month in early 2026, down from a peak of 12 million in March 2022 but still well above the pre-pandemic average of 7 million. Source: Job Openings and Labor Turnover Survey (JOLTS), U.S. Bureau of Labor Statistics, 2026
2. U.S. unemployment held at 4.1% in March 2026, with 6.7 million people unemployed. Source: Employment Situation Summary, U.S. Bureau of Labor Statistics, 2026
3. UK unemployment reached 4.4% in Q1 2026, with vacancy levels still 25% above pre-2020 baselines. Source: UK Office for National Statistics, 2026
4. 74% of employers globally reported difficulty finding talent in 2024-2025, the highest level in 18 years. Source: ManpowerGroup Talent Shortage Survey, 2024
5. Hiring volume rebounded 8.3% year-over-year in 2025-2026, marking the first sustained recovery since the 2022 correction. Source: Gem 2026 Recruiting Benchmarks (based on 165M applicants, 15M candidates, 1.2M hires)
6. Applications per job posting surged 93% in 2025, largely driven by AI-assisted application tools and auto-apply features. Source: Gem 2026 Recruiting Benchmarks
7. LinkedIn job applications hit 14,200 per minute in February 2025 — an all-time high. Source: LinkedIn Talent Solutions, 2025
What are the current time-to-fill and speed benchmarks?
8. Average time-to-fill across all industries was 44 days in 2025, up from 42 days in 2023. Source: SHRM Talent Acquisition Benchmarks, 2025
9. Engineering and technical roles averaged 62 days to fill, the highest of any functional category. Source: Gem 2026 Recruiting Benchmarks
10. Time from first contact to offer acceptance averaged 28 days for roles using AI-assisted sourcing, versus 41 days for manual sourcing. Source: Aptitude Research, 2025 AI in Talent Acquisition Report
11. The average interview process involves 13 interviews per hire, up 42% from three years ago. Source: Gem 2026 Recruiting Benchmarks
12. 57% of candidates say they've dropped out of a hiring process because it took too long. Source: Talent Board 2025 Candidate Experience Report
What are cost-per-hire and recruiting budget benchmarks?
13. Average cost-per-hire was $4,700 across all industries and company sizes. Source: SHRM/ANSI Cost-Per-Hire Standard (most recent canonical benchmark)
14. Cost-per-hire for technical roles averaged $8,400-$12,000, with specialized AI/ML roles exceeding $15,000. Source: Bersin by Deloitte, 2025 Talent Acquisition Framework
15. Companies using AI sourcing tools reported 35-45% lower cost-per-hire compared to companies relying exclusively on job boards and agency relationships. Source: Aptitude Research, 2025 AI in Talent Acquisition Report
16. Recruitment agency fees averaged 20-25% of first-year salary for professional and technical roles. Source: SHRM 2025 Staffing Industry Analysis
17. TA teams are 14% leaner than they were in 2021, even as hiring volume has recovered. Source: Gem 2026 Recruiting Benchmarks
18. Recruiters are managing 43% more req volume per person than they did in 2021. Source: Gem 2026 Recruiting Benchmarks
What's the current state of AI adoption in recruiting?
19. 84% of talent leaders plan to use AI in recruiting in 2026. Source: Korn Ferry 12th Annual Talent Acquisition Trends Report, 2026 (based on 1,670 global talent leaders)
20. Enterprise AI agent deployment quadrupled from 11% to 42% in the second half of 2025. Source: KPMG Q3 2025 AI Pulse Survey
21. 52% of talent leaders plan to add autonomous AI agents to their recruiting teams in 2026. Source: Korn Ferry 2026 TA Trends Report
22. 82% of HR leaders planned AI agent deployment within 12 months (surveyed mid-2025). Source: Gartner HR Leaders AI Agents Survey, 2025
23. 42% of organizations had deployed at least one AI agent in production by end of 2025. Source: KPMG Q3 2025 AI Pulse Survey
24. Only 24% of TA leaders expect headcount increases on their recruiting teams in 2026. Source: SHRM 2026 Talent Acquisition Trends
25. 23% of organizations using AI in recruiting are scaling beyond pilot programs. Source: McKinsey Global AI Survey, 2025
What are the latest sourcing and outreach metrics?
26. The average recruiter InMail response rate on LinkedIn was 18-25% for personalized messages, versus 5-8% for template messages. Source: LinkedIn Talent Solutions Benchmarks, 2025
27. Multi-channel outreach (email + LinkedIn + SMS) generates 287% higher engagement than single-channel approaches. Source: Landbase 2025 Outreach Benchmark Report
28. 46% of hires came from rediscovered talent — candidates already in the ATS database who were re-engaged for new roles. Source: Gem 2026 Recruiting Benchmarks
29. Passive candidates represent approximately 70% of the workforce, but only 30% are actively looking at any given time. Source: LinkedIn Talent Solutions Global Talent Trends, 2025
30. Sourcing messages sent at 7-8 AM local time on Tuesdays and Wednesdays had the highest response rates across email and LinkedIn. Source: Gem 2025 Outreach Timing Analysis
31. AI-personalized outreach messages achieved 3-4x higher response rates compared to template-based campaigns. Source: Aggregated data from Noon platform, 2025-2026
What do candidate experience and offer metrics show?
32. Offer acceptance rates averaged 82% across all roles and industries. Source: Gem 2026 Recruiting Benchmarks
33. 76% of candidates say the hiring process directly influences their perception of the company. Source: Talent Board 2025 Candidate Experience Research
34. Companies rated highest for candidate experience saw 70% higher quality-of-hire ratings from hiring managers. Source: Talent Board 2025 CandE Benchmark Research
35. The average number of applications per candidate increased 48% from 2023 to 2025, driven by AI-assisted application tools. Source: Greenhouse 2025 Hiring Trends Report
36. 63% of candidates reported receiving at least one AI-generated outreach message that felt impersonal or irrelevant. Source: Talent Board 2025 Candidate Experience Report
What are the latest diversity and skills-based hiring statistics?
37. 53% of employers eliminated degree requirements from job postings in 2025, up from 30% in 2024. Source: TestGorilla 2025 State of Skills-Based Hiring Report
38. Simply removing degree language lifts non-BA hiring by only 3.5 percentage points. Companies with assessment infrastructure achieve nearly 20%. Source: Harvard Business School and Burning Glass Institute, 2025
39. Organizations with diverse leadership teams outperformed peers by 39% in profitability. Source: McKinsey "Diversity Wins" series, updated 2025
40. 72% of TA teams reported that AI sourcing tools surfaced more diverse candidate slates than manual sourcing. Source: Aptitude Research 2025 AI in Talent Acquisition Report
41. Only 37% of organizations conduct regular bias audits on their AI recruiting tools. Source: Mercer 2025 Global Talent Trends
What do recruiting technology metrics reveal?
42. The average enterprise recruiting stack includes 12-15 tools, from ATS to CRM to sourcing to scheduling to analytics. Source: Aptitude Research 2025 TA Technology Stack Report
43. 67% of TA leaders say their recruiting stack is "too fragmented" and plan to consolidate in 2026-2027. Source: Aptitude Research 2025 TA Technology Stack Report
44. ATS adoption stands at 78% across organizations with 500+ employees, making it the most widely adopted recruiting technology. Source: HR.com 2025 State of HR Technology Report
45. CRM adoption lags at 21% despite being available for over a decade. Source: HR.com 2025 State of HR Technology Report
46. Integration between AI sourcing tools and ATS platforms reduces data entry by 8-12 hours per recruiter per week. Source: Aggregate implementation data from AI sourcing vendors including Noon, 2025-2026
What are current retention and quality-of-hire benchmarks?
47. The average cost of a bad hire is estimated at 30% of the employee's first-year salary. Source: U.S. Department of Labor (canonical benchmark, frequently cited by SHRM)
48. 46% of new hires fail within the first 18 months, with 89% of those failures attributed to cultural or attitudinal factors rather than technical skills. Source: Leadership IQ "Hiring for Attitude" study (canonical benchmark)
49. Organizations that combine pre-hire assessments with post-hire performance tracking improve quality-of-hire ratings by 30-40%. Source: LinkedIn Talent Solutions, 2025 Future of Recruiting Report
50. Employee referrals remain the highest-quality source of hire, with 45% higher retention rates at 2 years compared to job board hires. Source: SHRM 2025 Employee Referral Program Benchmarks
What do these recruitment statistics mean for your strategy?
The data tells a consistent story: the recruiting function is being compressed. Fewer people handling more volume, with AI absorbing the repetitive work. The teams that outperform aren't the ones with the most recruiters or the biggest job board budgets — they're the ones with the best systems.
Three takeaways:
1. Speed is the competitive advantage. At 44 days average time-to-fill and 57% of candidates dropping out of slow processes, the ability to source, screen, and engage candidates quickly is the difference between making and missing hires.
2. Personalization beats volume. With applications surging 93% and candidates overwhelmed by generic outreach, the response rate premium for personalized messages (3-4x higher) is the most important metric in the stack.
3. AI adoption is no longer optional. At 84% planning to use AI and 52% adding autonomous agents, the question isn't whether to adopt AI in recruiting — it's whether you're adopting the right kind. Tools that learn from your behavior (RLHF) deliver compounding value. Tools that run the same keyword matching with a new interface don't.
Noon was built around these realities. The platform's autonomous agent handles sourcing, screening, and outreach while learning from every recruiter interaction, turning the "more req volume per recruiter" challenge from a crisis into an operating advantage. If you're looking to adopt AI that adapts to your hiring patterns and improves with use, book a demo to see how the agent learns from your team's feedback.
FAQ
What is the average time-to-fill in 2026? The average time-to-fill across all industries is 44 days (SHRM 2025 benchmarks). Engineering and technical roles average 62 days (Gem 2026). Roles using AI-assisted sourcing average 28 days from first contact to offer acceptance, versus 41 days for manual sourcing (Aptitude Research 2025).
What is the average cost-per-hire in 2026? The SHRM/ANSI benchmark is $4,700 across all industries. Technical roles average $8,400-$12,000, with specialized AI/ML roles exceeding $15,000. Companies using AI sourcing tools report 35-45% lower cost-per-hire compared to relying solely on job boards and agencies.
What percentage of companies use AI in recruiting? 84% of talent leaders plan to use AI in some capacity in 2026 (Korn Ferry). 42% of enterprises have deployed at least one AI agent (KPMG). 52% plan to add autonomous AI agents specifically for recruiting (Korn Ferry).
How effective is AI-powered outreach compared to manual outreach? AI-personalized outreach achieves 3-4x higher response rates compared to template campaigns. Multi-channel approaches (email + LinkedIn) generate 287% higher engagement than single-channel. The key differentiator is genuine personalization — referencing the candidate's specific experience — not just inserting their name into a template.
What is the biggest recruiting challenge in 2026? 74% of employers globally report difficulty finding talent (ManpowerGroup). But the data suggests the problem isn't talent scarcity — it's matching efficiency. With applications surging 93% and 46% of hires coming from rediscovered talent already in ATS databases, the challenge is finding the right candidates in an ocean of noise, not finding candidates at all.