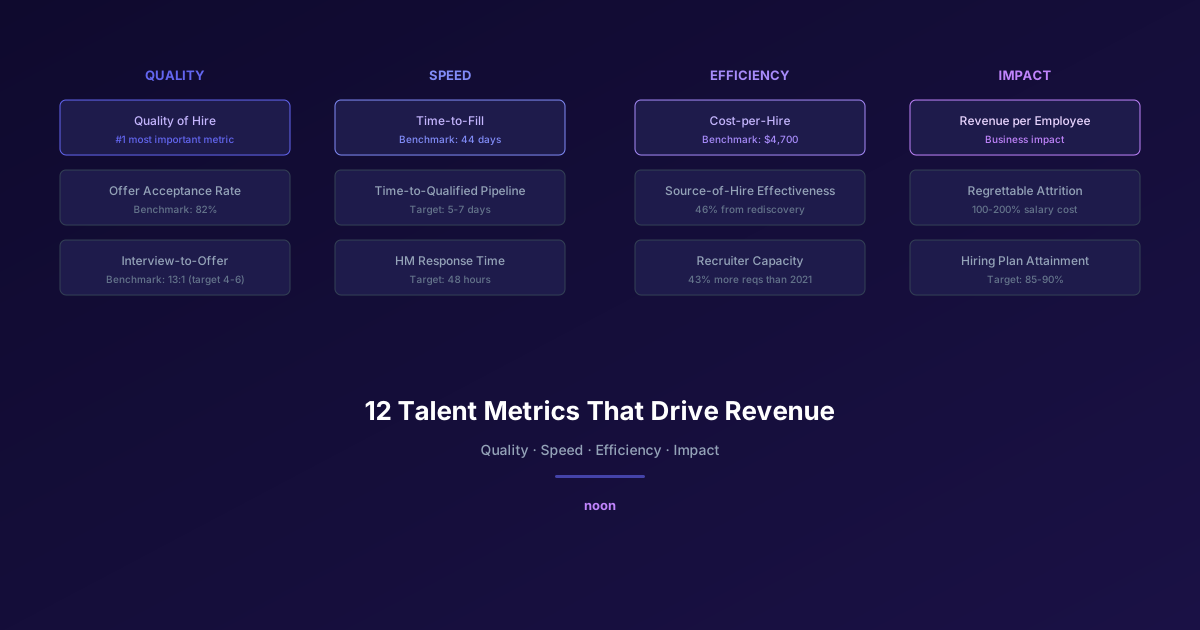
Key takeaway: The 12 talent management metrics that drive revenue are: quality of hire, offer acceptance rate, interview-to-offer ratio, time-to-fill, time-to-qualified-pipeline, hiring manager response time, cost-per-hire, source-of-hire effectiveness, recruiter capacity utilization, revenue per employee, regrettable attrition rate, and hiring plan attainment. Track these monthly, benchmark quarterly, and tie recruiting metrics directly to business outcomes.
The average recruiting team tracks metrics. The question is whether they track the right ones.
Most TA dashboards are dominated by activity metrics: applications received, screens completed, interviews conducted, job posts active. These measure effort, not outcomes. A team that conducts 200 interviews to make 10 hires is working hard. Whether they're working effectively depends on entirely different numbers.
The metrics that actually predict hiring success — and ultimately revenue impact — measure quality, speed, and efficiency. They answer questions like: Are we finding the right people? Are we finding them fast enough? Are our hires actually performing?
Here are the 12 metrics that drive revenue, organized into four categories, with current benchmarks, calculation formulas, and guidance on how to improve each one.
Category 1: Quality metrics
1. Quality of hire
What it measures: How well new hires perform relative to expectations.
Why it matters: This is the single most important recruiting metric. Everything else — speed, cost, volume — is a means to this end. A fast, cheap hire who underperforms costs more than a slow, expensive hire who delivers.
How to calculate: Quality of hire = Average of (Performance rating + Hiring manager satisfaction + Ramp time achievement + 12-month retention) / 4
Each component is scored on a 1-5 scale and combined. Some organizations weight components differently based on business priorities.
Current benchmark: LinkedIn's 2025 Future of Recruiting report found that 89% of TA leaders consider quality of hire the most important metric, but only 25% feel confident they can measure it effectively.
How to improve: The biggest lever is connecting pre-hire data with post-hire outcomes. When you know which sourcing channels, interview scores, and candidate profiles predict 12-month success, you can optimize for quality throughout the funnel. Noon's RLHF system does this implicitly — by learning which candidates recruiters advance and tracking aggregate patterns, the system continuously optimizes for the characteristics that correlate with successful hires.
2. Offer acceptance rate
What it measures: The percentage of extended offers that are accepted.
Formula: Offer acceptance rate = (Offers accepted / Offers extended) × 100
Current benchmark: 82% across all roles and industries (Gem 2026 Recruiting Benchmarks). Technical roles typically see lower rates (75-80%) due to competitive markets.
Why it matters: Low offer acceptance wastes the entire pipeline investment. If you sourced 200 candidates, screened 50, interviewed 15, and extended 3 offers — only to have 2 declined — you've consumed 90% of the cost with 33% of the output.
How to improve: Align compensation expectations early (don't wait until the offer to discover a gap). Compress timeline — candidates who wait 3+ weeks for an offer are more likely to accept competing offers. Sell the opportunity throughout the process, not just at the offer stage.
3. Interview-to-offer ratio
What it measures: How many interviews it takes to generate one offer.
Formula: Interview-to-offer ratio = Total interviews / Offers extended
Current benchmark: 13 interviews per hire (Gem 2026), up 42% in three years. This is too high — it indicates either poor candidate quality entering the interview stage or misalignment between recruiter screening and hiring manager expectations.
Target: 4-6 interviews per offer indicates strong pre-screening. Above 10 suggests a matching problem.
How to improve: Better pre-screening catches mismatches before the interview stage. AI screening that evaluates candidates contextually — not just by keyword matching — reduces the number of unqualified candidates reaching interviews. At Noon, LLM-based screening against non-negotiables significantly reduces false positives in the pipeline.
Category 2: Speed metrics
4. Time-to-fill
What it measures: Calendar days from requisition opening to offer acceptance.
Formula: Time-to-fill = Date of offer acceptance - Date requisition opened
Current benchmark: 44 days average across all industries (SHRM 2025). Engineering roles: 62 days (Gem 2026). Roles using AI sourcing: 28 days from first contact to offer acceptance (Aptitude Research 2025).
Why it matters: Every unfilled day costs $1,000-2,250 in lost productivity. For a 10-person engineering team with two open roles, that's $60,000-135,000 per month in productivity loss.
How to improve: The sourcing phase (typically 15-25 days) is the biggest compression opportunity. AI sourcing agents like Noon reduce this to days by searching autonomously and presenting qualified candidates within the first week. Proactive recruitment — maintaining warm pipelines for recurring roles — can eliminate the sourcing phase entirely.
5. Time-to-qualified-pipeline
What it measures: How long it takes to build a pipeline of candidates who pass initial screening.
Formula: Time-to-qualified-pipeline = Date first qualified candidate enters pipeline - Date requisition opened
Why it matters more than time-to-fill: Time-to-fill includes interview scheduling and decision-making time that's largely outside TA's control. Time-to-qualified-pipeline measures what TA actually controls: how fast can you find people worth interviewing?
Target: 5-7 business days for most professional roles. AI sourcing tools can compress this to 1-3 days.
6. Hiring manager response time
What it measures: Time from candidate submission to hiring manager feedback.
Formula: Average days from "submitted to HM" to "HM provided feedback"
Why it matters: This is often the biggest hidden bottleneck. A hiring manager who takes two weeks to review submitted candidates adds two weeks to every search — regardless of how fast sourcing happens. And candidates don't wait — they accept other offers.
Target: 48 hours. Beyond 72 hours, candidate quality degrades as top candidates move on.
Category 3: Efficiency metrics
7. Cost-per-hire
What it measures: Total recruiting investment divided by number of hires.
Formula: Cost-per-hire = (External costs + Internal costs) / Total hires
External costs: job board fees, agency fees, tool subscriptions, advertising. Internal costs: recruiter salaries, interview time, background checks.
Current benchmark: $4,700 average across all industries (SHRM/ANSI). Technical roles: $8,400-12,000 (Bersin). AI/ML specialists: $15,000+ (Bersin 2025).
How to improve: Reduce reliance on agencies (20-25% of salary per placement). Increase referral hiring (lowest cost per hire). Use AI sourcing to replace job board spend. Track cost-per-quality-hire rather than just cost-per-hire — a $10,000 hire who performs in the 90th percentile is better value than a $3,000 hire who underperforms.
8. Source-of-hire effectiveness
What it measures: Which sourcing channels produce the most hires, and at what quality and cost.
How to measure: Track every hire back to its original source — referral, LinkedIn, AI sourcing, job board, career site, agency. Then compare sources on:
- Volume of hires
- Cost per hire from each source
- Quality of hire by source
- Time-to-fill by source
What the data typically shows: Referrals: lowest cost, highest quality, fastest time-to-fill. AI sourcing: moderate cost, high quality, moderate speed. Agencies: highest cost, variable quality. Job boards: low cost per application, high cost per quality hire.
Current benchmark: 46% of hires came from rediscovered talent — candidates already in the ATS (Gem 2026). This suggests most organizations are under-leveraging their existing database.
9. Recruiter capacity utilization
What it measures: How effectively recruiter time is allocated.
Formula: Recruiter capacity = Active requisitions per recruiter
Current benchmark: Recruiters are managing 43% more req volume than in 2021 (Gem 2026). The breaking point is typically 25-30 active reqs per recruiter — beyond that, response times slow, candidate experience degrades, and quality drops.
How to improve: AI handles the high-volume, repetitive tasks (sourcing, screening, outreach) so recruiters can focus on high-value work (hiring manager consulting, candidate experience, closing). Teams using Noon report that the AI absorbs 60-70% of sourcing and initial screening time, enabling recruiters to manage higher req loads without quality degradation. If you're tracking these capacity metrics and finding your team stretched thin, you can book a demo to see how autonomous sourcing affects recruiter bandwidth in practice.
Category 4: Impact metrics
10. Revenue per employee
What it measures: Total company revenue divided by total employees.
Formula: Revenue per employee = Annual revenue / Total headcount
Why it's a recruiting metric: The quality of hiring directly impacts revenue per employee. Better hires produce more revenue per person. When TA leaders can show that improving quality of hire by 10% increased revenue per employee by X%, they've connected recruiting to business outcomes.
How to use it: Track revenue per employee by team and correlate with recruiting source, time-to-fill, and interview scores. This creates the data infrastructure for quality-of-hire prediction.
11. Regrettable attrition rate
What it measures: The percentage of high-performing employees who leave voluntarily.
Formula: Regrettable attrition = (High-performer voluntary departures / Total high performers) × 100
Why it matters: Not all turnover is bad. Losing an underperformer may be neutral or positive. Losing a top performer is expensive — estimated at 100-200% of their annual salary in replacement costs, lost productivity, and institutional knowledge.
The recruiting connection: High regrettable attrition often indicates a matching problem — candidates were attracted for reasons that didn't match the reality of the role. Better evaluation, more transparent job descriptions, and honest selling during the interview process reduce regrettable attrition.
12. Hiring plan attainment
What it measures: What percentage of planned hires were actually made within the planned timeframe.
Formula: Hiring plan attainment = (Actual hires / Planned hires) × 100, for each quarter
Why it matters: When TA misses the hiring plan, business plans fail. Product launches delay. Revenue targets miss. Customer commitments go unmet. Hiring plan attainment is the metric that connects TA performance to business execution.
Target: 85-90% quarterly attainment is strong. Below 75% indicates systemic issues in either workforce planning or recruiting execution.
How do you build a talent metrics dashboard?
Not every organization needs all 12 metrics. Start with the minimum viable dashboard:
Essential (track from day one):
- Time-to-fill
- Offer acceptance rate
- Cost-per-hire
- Source-of-hire
Important (add in quarter 2):
- Quality of hire (requires post-hire data connection)
- Interview-to-offer ratio
- Hiring manager response time
- Hiring plan attainment
Advanced (add as data infrastructure matures):
- Revenue per employee correlation
- Regrettable attrition by source
- Recruiter capacity utilization
- Time-to-qualified-pipeline
FAQ
What is the most important recruiting metric? Quality of hire. Every other metric — speed, cost, volume — is a means to this end. However, quality of hire is also the hardest to measure because it requires connecting recruiting data with post-hire performance data. If you can only track one metric today, start with offer acceptance rate as a proxy.
What is a good time-to-fill benchmark? 44 days is the current average across all industries (SHRM 2025). Engineering roles average 62 days (Gem 2026). Roles using AI sourcing average 28 days from first contact to offer (Aptitude Research 2025). Your target should be industry-appropriate — don't compare retail hiring benchmarks to enterprise engineering.
How do I connect recruiting metrics to business outcomes? Track revenue per employee by team and correlate with recruiting source, interview scores, and time-to-fill. When you can show that candidates sourced through a specific channel produce 15% higher revenue per person, you've connected TA performance to business impact.
What recruiting metrics should I report to the C-suite? Three: hiring plan attainment (are we meeting the hiring commitments the business depends on), quality of hire (are new hires performing), and cost efficiency (cost-per-hire relative to quality). Executive audiences care about outcomes, not activity.
How does AI improve recruiting metrics? AI directly impacts time-to-fill (autonomous sourcing compresses from weeks to days), interview-to-offer ratio (better screening reduces unqualified candidates reaching interviews), and cost-per-hire (reducing agency and job board spend). Platforms like Noon additionally improve quality of hire through RLHF — the system learns which candidates succeed and optimizes for similar profiles.