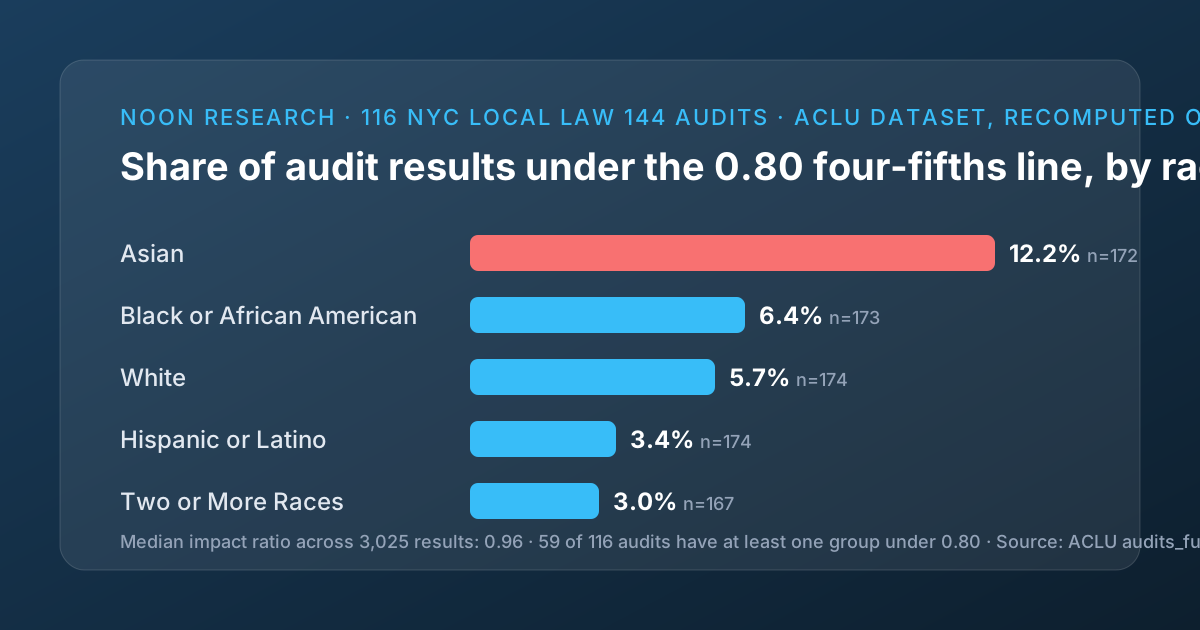
Key takeaway: 59 of the 116 public NYC Local Law 144 bias audits collected by the ACLU (50.9%) report at least one demographic group under the 0.8 "four-fifths" line, even though the median of the 3,025 impact ratios we recomputed is 0.96 and only 7.7% of all group results fall below it. New York City is the only place in the United States where employers must publish bias audits of the AI tools they use to screen candidates, and these audits date from 2023 and 2024. Asian candidates are the group most often under the line (12.2% of race-only results, 17.0% of intersectional results). One vendor (HireVue) accounts for 67 of the 116 audits, and one auditor (DCI Consulting) for 70. As of 15 October 2026, 77 of 83 original audit URLs still load.
Since 5 July 2023, NYC Local Law 144 has required any employer or agency using an "automated employment decision tool" on NYC candidates to commission an independent bias audit within the last year and publish a summary of its results. The audit must report selection (or scoring) rates and impact ratios by sex, by race/ethnicity and for the intersection of the two. The law does not set a pass mark; it only forces disclosure. (For the other AI hiring rules now in force, see AI hiring compliance in 2026.)
That makes the published audits the only public, numeric record of how AI hiring tools actually treat demographic groups in production, even as AI use in hiring spreads well beyond New York. Researchers at the ACLU collected every audit they could find through November 2024 and released the standardized data with their FAccT 2025 paper ("Auditing the Audits"); they also maintain a running tracker of new and removed reports. This article is a Noon Research re-analysis of that public data, with three additions of our own: every figure recomputed from the CSV with a published script, a link-liveness check of the original reports run on 15 October 2026, and a read of the audits posted in 2025 and 2026 that are not in the dataset.
What is in the dataset?
| Parameter | Value |
|---|---|
| Source | ACLU audits_full.csv (FAccT 2025 replication materials), audits known as of November 2024 |
| Audits | 116 (75 with results dated 2023, 41 dated 2024) |
| Distinct audit reports | 44 (one vendor report is often posted by many employers, so one report can count as several audits) |
| Group-level results | 4,507 rows; 3,025 with a numeric impact ratio |
| Breakdown of rows | 2,611 intersectional (race x sex), 1,378 race/ethnicity, 518 sex |
| Data basis | 101 audits used historical applicant data, 9 used test data, 6 unknown |
| Tool type | 3,871 rows from selection tools (advance / do not advance), 636 from scoring tools (ranked by score) |
The ACLU's own paper is about who complies and who does not. We asked a different question: taking the audits that do exist at face value, what do the numbers say?
How many AI hiring tools fall under the four-fifths line?
The four-fifths rule (an impact ratio of 0.80 or lower) is the long-standing EEOC threshold for a first look at adverse impact; LL144 borrows the metric without turning it into a pass/fail standard. Across the 3,025 group results with a numeric impact ratio:
| Measure | Value |
|---|---|
| Median impact ratio, all results | 0.96 |
| Results under 0.80 | 234 of 3,025 (7.7%) |
| Audits with at least one group under 0.80 | 59 of 116 (50.9%) |
| Audits with every reported group at 0.80 or above | 56 of 116 (48.3%) |
| Audits with no numeric impact ratio at all | 1 |
Read together: the typical group result is close to parity, but half of all published audits contain at least one group the tool selects at less than 80% of the rate of the best-performing group. Because an audit reports many groups and intersections (up to 39 rows for a single tool), a single sub-0.80 cell is common even when the headline sex and race rows look clean.
Selection tools fare worse than scoring tools: 8.8% of selection-tool results are under 0.80 versus 1.7% of scoring-tool results (scoring audits report whether a group scores above the median, which compresses differences). Audits run on historical applicant data show 8.2% of results under 0.80; the nine audits run on test data show 2.9%.
Which groups are most often under the line?
By sex alone, no group falls under the line in any audit: the median female impact ratio is 0.98 (n = 174 results) and the median male ratio is 1.00. The disparities appear by race/ethnicity and, more sharply, at the intersections.
| Race/ethnicity (single characteristic) | Results | Median impact ratio | Share under 0.80 |
|---|---|---|---|
| Asian | 172 | 0.92 | 12.2% |
| Black or African American | 173 | 0.96 | 6.4% |
| White | 174 | 0.98 | 5.7% |
| Hispanic or Latino | 174 | 0.97 | 3.4% |
| Two or More Races | 167 | 0.98 | 3.0% |
| American Indian or Alaska Native | 31 | 0.98 | 12.9% |
| Native Hawaiian or Other Pacific Islander | 24 | 0.845 | 45.8% |
The two smallest groups (American Indian or Alaska Native, Native Hawaiian or Other Pacific Islander) are reported in far fewer audits because most audits drop categories with too few applicants, so their percentages rest on 31 and 24 results respectively and should be read as indicative, not precise.
At the intersection of race and sex, the pattern repeats and widens:
| Race/ethnicity (intersectional rows) | Results | Median impact ratio | Share under 0.80 |
|---|---|---|---|
| Asian (male or female) | 341 | 0.90 | 17.0% |
| Black or African American | 350 | 0.94 | 7.1% |
| Hispanic or Latino | 347 | 0.94 | 6.1% |
| White | 352 | 0.96 | 6.2% |
| Two or More Races | 298 | 0.967 | 6.0% |
| American Indian or Alaska Native | 40 | 0.915 | 25.0% |
| Native Hawaiian or Other Pacific Islander | 34 | 0.90 | 35.3% |
The single intersectional cells most often under 0.80 are Asian men (33 results), Asian women (25), women of two or more races (16) and White women (15). The common assumption that AI screening disadvantages women as a class is not what the NYC audits show; the measurable disparities in this data are by race, concentrated on Asian applicants, and they surface at the intersectional level more than in the headline rows.
Which vendors and auditors dominate the public record?
The public record is not a survey of the AI hiring tools market. It is dominated by one vendor whose customers post the same report:
| Tool vendor | Audits | Group results with impact ratio | Median impact ratio | Share under 0.80 |
|---|---|---|---|---|
| HireVue | 67 | 2,144 | 0.96 | 8.4% |
| Talent Plus | 5 | 83 | 0.94 | 0.0% |
| ADP | 4 | 102 | 0.966 | 0.0% |
| Eightfold | 4 | 85 | 0.928 | 0.0% |
| HackerRank | 4 | 51 | 0.988 | 0.0% |
| Paradox | 4 | 57 | 0.99 | 0.0% |
| Dover | 1 report | 46 | 0.532 | 54.3% |
| Unknown vendor | 4 | 85 | 0.88 | 25.9% |
HireVue alone is 67 of 116 audits and 2,144 of 3,025 numeric results, so the overall figures above are to a large degree HireVue figures. The single worst public result belongs to Dover's candidate-ranking tool, whose audit reports a median impact ratio of 0.532 with more than half of its group results under 0.80; the audit was published, which is exactly what the law asks for.
Auditors are just as concentrated: DCI Consulting Group signed 70 of the 116 audits, Holistic AI 12, BABL AI 9, BLDS 6, Conductor AI 6, Ambrose Consulting 5. Four audits do not name the auditor.
Are the audits still online in October 2026?
LL144 requires the summary to be posted, not archived. We fetched every distinct original-source URL in the ACLU dataset and tracker (83 URLs, excluding the ACLU's perma.cc archive copies) on 15 October 2026:
| Status | URLs |
|---|---|
| Loads (HTTP 200) | 77 |
| Not found (404) | 3 (a RippleMatch PDF and two Warden AI dashboards, for Kyloe and MegaHR) |
| Blocked or refused (403 / 406) | 2 (an ADP PDF, a JetBlue legal page) |
| Unreachable | 1 (Covey) |
In addition, the ACLU tracker itself already marks 13 of its 98 rows as "removed from employer website", with only the perma.cc capture surviving. Taken together, roughly one in five audit summaries that were ever posted can no longer be read at the original address.
What changed in the 2025 and 2026 audits?
The tracker lists only 2 audits dated 2025 and 13 dated 2026 (its collection is volunteer-run, so this is a floor, not a count of compliance). The format has shifted. Eleven of the 13 audits dated 2026 are not PDFs but continuous "AI assurance dashboards" hosted by a single auditor, Warden AI, for vendors including Greenhouse, Ashby, Juicebox, Hireology, ModernLoop, Tribepad, Classet, Alex, Elly, VONQ and Whippy. We fetched 10 of them. They state an audit frequency (monthly), a latest-audit date and a sample size (from 6,268 to 345,739 candidates), and they grade each protected characteristic as "Clear", "Consider" or "Concern"; six of the ten show a count of checks (14 to 110), all of them Clear. The numeric impact ratios that LL144 requires sit in a downloadable report rather than on the page, so they cannot be compared with the 2023-2024 tables above without opening each PDF. Whether a monthly dashboard with pass/fail labels satisfies the spirit of a published summary of results is a question for the city, but it is where the market has moved.
What should recruiting teams take from this?
- A clean headline does not mean a clean audit. Half of the public audits have at least one group under 0.80 once intersections are reported. Ask vendors for the full table, not the summary paragraph.
- Ask specifically about Asian applicants and about small groups. That is where the public data shows the disparities, not in the female/male comparison most buyers ask about first.
- Prefer audits on your own historical data. Test-data audits look better (2.9% of results under 0.80) partly because the test data is cleaner; what matters is how the tool behaves on your applicant pool. The same logic applies to human steps: structured interviews are easier to audit than unstructured ones because every candidate is scored on the same criteria.
- Keep your own copy. One in five posted summaries has already disappeared from its original address, and a tool you bought in 2024 may be audited under a different format in 2026.
Where Noon fits
Noon's AI candidate screening evaluates every candidate against the role's written criteria and non-negotiables, and recruiter and hiring-manager feedback recalibrates it per role, so the criteria a bias review needs to inspect are explicit rather than implicit. Noon runs on one plan with unlimited sourcing and seats, and you can see the workflow end to end on the product overview. This article is about the public record, not about Noon's own tools; the data above comes entirely from the ACLU dataset and the public audit pages.
Methodology
- Source data.
audits_full.csvfrom the ACLU's "Auditing the Audits" (FAccT 2025) replication repository, downloaded 15 October 2026. The ACLU states the file covers 116 publicly available LL144-related audits known as of November 2024, standardized into one row per demographic group or intersection. We did not alter the file. - Definitions. An "audit" is a distinct
audit_id(an employer-tool pairing); a "report" is a distinctaudit_report_id(a vendor report posted by several employers counts once). A "result" is one row (one group or intersection for one tool). "Under the line" meansimpact_ratio< 0.80; rows without a numeric impact ratio (1,482 of 4,507, mostly groups with too few applicants or scoring rows reported without a ratio) are excluded from rate calculations but counted in totals. - Statistics. All counts, medians and shares were computed with
seo/research/stats/ll144-bias-audits-2026/compute.py(Python standard library only) and saved toresults.jsonin the same folder; every number in this article is read from that file. - Link check.
liveness.jsonrecords an HTTP GET (25-second timeout, browser user agent, redirects followed) for each of the 83 distinct original-source URLs in the CSV and the ACLU tracker on 15 October 2026. perma.cc archive links were excluded because perma.cc refuses automated requests. A 403 or 406 is reported as blocked, not as removed. - 2025-2026 additions. The 15 tracker rows dated 2025 or 2026 were read by hand; the 10 Warden AI dashboards fetched on 15 October 2026 are summarized in
additions_2025_2026.json.
Limitations
- Published audits are not a random sample of AI hiring tools. Compliance with LL144 is widely reported to be low, and the dataset over-represents one vendor (HireVue, 67 of 116 audits) and one auditor (DCI, 70 of 116). The aggregate figures describe the public record, not the market.
- Impact ratios are not comparable across tools without care: audits differ in the applicant populations, in whether they use historical or test data, in how they define "selected" (top category versus top and middle) and in how they handle small groups. We report medians and shares across rows for that reason, not pooled selection rates.
- The 0.80 line is a screening heuristic, not a legal finding of discrimination, and a ratio above 0.80 does not establish fairness.
- The dataset ends in November 2024. The 2025-2026 audits we describe are read from the ACLU tracker and vendor dashboards and are not included in the statistics.
- Noon did not collect any of the underlying audit data. Our contribution is the recomputation, the liveness check and the 2026 format review; the collection work is the ACLU's.
FAQ
What does NYC Local Law 144 require? Employers and employment agencies that use an automated employment decision tool to substantially assist hiring or promotion decisions for NYC candidates must have the tool independently audited for bias within the past year, publish a summary of the audit (selection or scoring rates and impact ratios by sex, race/ethnicity and their intersections), and notify candidates that the tool is used. The law has been enforced since 5 July 2023.
What is an impact ratio? The selection rate of one demographic group divided by the selection rate of the group with the highest rate. A ratio of 0.80 or lower is the EEOC's traditional "four-fifths" trigger for examining adverse impact. LL144 requires the ratio to be reported but does not set a minimum.
Do most AI hiring tools pass the four-fifths test? In the public NYC audits, 48.3% of audits (56 of 116) report every group at 0.80 or above and 50.9% (59 of 116) have at least one group under 0.80. Across all 3,025 individual group results, 92.3% are at or above 0.80.
Which group is most affected in the published audits? Asian applicants: 12.2% of race-only results and 17.0% of intersectional results for Asian candidates are under 0.80, versus 3% to 7% for most other groups. No sex-only result in the dataset is under 0.80.
How many companies have actually published an audit? The ACLU dataset contains 116 audits from 44 distinct reports through November 2024, and the ACLU tracker lists 98 rows as of October 2026, 13 of which have been removed from the employer's website. Independent studies have found publication rates in the low single digits among NYC employers, so these figures are a floor.