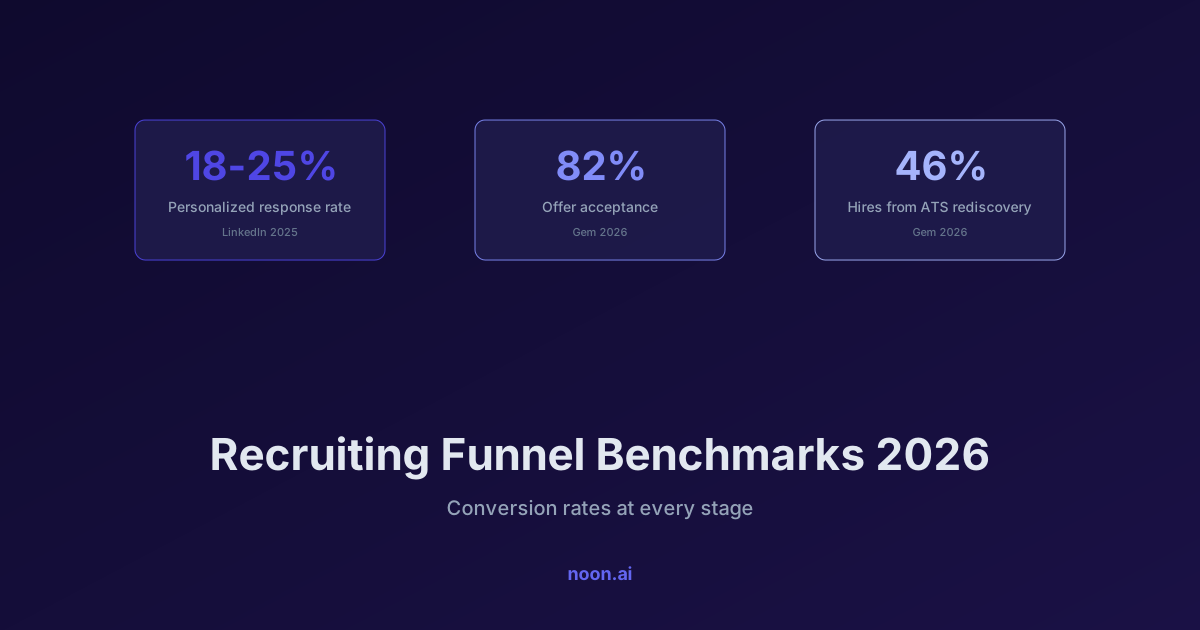
Key takeaway: 2026 recruiting funnel benchmarks: personalized outreach gets 18-25% response rates versus 5-8% for templates (LinkedIn), multi-channel sequences drive 287% higher engagement than single-channel (Landbase 2025), offer acceptance averages 82% (Gem 2026), 57% of candidates abandon slow processes (Talent Board), and 46% of hires come from candidates already in the ATS.
Most recruiting teams track one end of the funnel (applications or sourced candidates) and the other (hires), with a black box in between. That black box is where hires are lost — and where every meaningful improvement lives.
This article assembles the available stage-by-stage benchmarks for 2026, each with a named source, so you can find the stage where your funnel leaks worst. For the complete data set, see our 50 recruitment statistics.
The 2026 funnel at a glance
| Funnel stage | Benchmark | Source |
|---|---|---|
| Outreach → response (personalized) | 18-25% | LinkedIn Talent Solutions Benchmarks, 2025 |
| Outreach → response (template) | 5-8% | LinkedIn Talent Solutions Benchmarks, 2025 |
| Multi-channel vs. single-channel engagement | +287% | Landbase 2025 Outreach Benchmark Report |
| AI-personalized vs. template response rate | 3-4x | Aggregated Noon platform data, 2025-2026 |
| Process abandonment (too slow) | 57% of candidates | Talent Board 2025 Candidate Experience Report |
| Offer → acceptance | 82% | Gem 2026 Recruiting Benchmarks |
| Hires from rediscovered ATS talent | 46% | Gem 2026 Recruiting Benchmarks |
| New-hire failure within 18 months | 46% | Leadership IQ (canonical benchmark) |
| Median time-to-fill, nonexecutive roles | 39 days (down from 44 in 2025) | SHRM 2026 recruiting benchmarking |
| Requisitions per recruiter, extra-large employers | +67% year over year | SHRM 2026 recruiting benchmarking |
Top of funnel: outreach and application benchmarks
Personalization triples your response rate. Personalized recruiter InMails convert at 18-25% versus 5-8% for templates (LinkedIn 2025), and AI-personalized messages that reference the candidate's specific experience run 3-4x template rates (Noon platform data, 2025-2026). With applications per posting up 93% in a year (Gem 2026), candidates are drowning in generic messages — the personalization premium is widening, not shrinking.
Channel mix matters as much as message quality. Multi-channel sequences (email + LinkedIn + SMS) generate 287% higher engagement than any single channel (Landbase 2025). Timing compounds it: messages sent 7-8 AM local time on Tuesdays and Wednesdays get the highest response rates (Gem 2025 Outreach Timing Analysis).
Inbound volume is no longer a quality signal. LinkedIn hit 14,200 applications per minute in February 2025. High applicant counts now mostly measure AI auto-apply adoption, not employer attractiveness — which is why outbound and passive sourcing keep gaining share. Passive candidates are roughly 70% of the workforce, and only 30% of them are actively looking at any moment (LinkedIn 2025).
Middle of funnel: screening and interviews
The middle of the funnel is where elapsed time — and candidates — disappear:
- 13 interviews per hire on average, up 42% in three years (Gem 2026).
- 57% of candidates have abandoned a process for being too slow (Talent Board 2025).
- 39-day median time-to-fill for nonexecutive roles in 2026, down from 44 days in 2025, with the most effective organizations running about five days faster than the median (SHRM 2026 recruiting benchmarking); engineering roles remain the long tail at roughly 62 days (Gem 2026). Full breakdown in our time-to-hire benchmarks.
The practical implication: mid-funnel pass-through rates are inseparable from speed. A candidate who would have passed your onsite loop but dropped out in week three counts as a screening-stage loss in your dashboard, but the root cause was latency. Measure elapsed days per stage alongside conversion per stage or you'll fix the wrong thing.
Bottom of funnel: offers and acceptance
Offer acceptance averages 82% across roles and industries (Gem 2026). Below ~75%, something upstream is broken — usually comp misalignment discovered late, or momentum lost between final round and offer. Two supporting data points:
- 76% of candidates say the hiring process shapes their perception of the company (Talent Board 2025) — the funnel experience itself moves acceptance.
- Companies rated highest for candidate experience saw 70% higher quality-of-hire ratings from hiring managers (Talent Board 2025 CandE Research).
What changed in the 2026 benchmarks?
Three movements are worth re-baselining against, because they pull in opposite directions.
- The clock tightened. Median time-to-fill for nonexecutive roles fell to 39 days from 44 (SHRM 2026). If your internal target still says 45 days, you are now benchmarking against last year's median and losing candidates to teams that are not.
- Caseloads rose sharply. Requisitions per recruiter climbed 67% at extra-large organizations (SHRM 2026). Conversion rates that hold steady while caseload rises 67% are an improvement, not a plateau, and the funnel dashboard will not show that unless you track reqs per recruiter alongside it.
- The market itself is flat, not booming. Indeed's Job Postings Index stood at 101.0 on 30 June 2026, down 3.7% year over year (Indeed Hiring Lab, 23 July 2026). Falling time-to-fill in a flat market is a supply-side effect, so do not read your faster fills as evidence that your employer brand improved.
Taken together: the same funnel conversion rates delivered against 67% more reqs in six fewer days is the actual 2026 bar. See our mid-year recruiting trends for the full market picture.
The stage everyone ignores: rediscovery
46% of hires in 2025 came from candidates already in the company's ATS who were re-engaged for a new role (Gem 2026). That makes your existing database the single largest source of hire — ahead of any job board — yet most funnels have no rediscovery stage at all.
This is a solvable systems problem: past silver medalists, prior applicants, and previously-contacted prospects are pre-vetted pipeline sitting at effectively zero acquisition cost. Our candidate nurturing guide covers how to keep that pool warm.
How to use these benchmarks
- Instrument every stage transition — outreach→response, response→screen, screen→onsite, onsite→offer, offer→accept — plus elapsed days per stage.
- Fix the worst ratio first. A funnel converting 5% at outreach wastes everything downstream; one losing candidates mid-process wastes your most expensive stage (interviewer hours).
- Re-benchmark quarterly. The 2025-2026 shifts (93% application surge, 42% interview inflation) moved several of these numbers in a single year.
At Noon, the funnel is instrumented end-to-end by default: the autonomous agent sources across the whole web, runs personalized multi-channel outreach, books interviews via the AI Coordinator, and reports stage-level analytics — so the black box in the middle of the funnel becomes a dashboard. If you want to see stage-by-stage conversion reporting for your own reqs, you can book a demo to walk through the analytics dashboard. See how it compares to manual workflows in AI sourcing vs. manual sourcing.
FAQ
What is a good recruiter outreach response rate? 18-25% for personalized messages; 5-8% for templates (LinkedIn Talent Solutions, 2025). AI-personalized messages referencing specific candidate experience achieve 3-4x template rates.
What is the average offer acceptance rate in 2026? 82% across all roles and industries (Gem 2026 Recruiting Benchmarks). Sustained rates below ~75% usually indicate comp misalignment or process latency rather than candidate quality issues.
How many candidates make it from application to hire? End-to-end conversion varies too widely by role and volume for a single honest benchmark — which is why stage-level ratios (response, screen pass, onsite pass, offer accept) are the numbers worth tracking. The stages above have sourced benchmarks; multiply yours through to get your own baseline.
What percentage of hires come from existing ATS databases? 46% of hires came from rediscovered talent — candidates already in the ATS who were re-engaged (Gem 2026 Recruiting Benchmarks).
Why do candidates drop out of hiring funnels? Speed is the top controllable cause: 57% of candidates report abandoning a process because it took too long (Talent Board 2025). The average process now includes 13 interviews (Gem 2026), up 42% in three years.