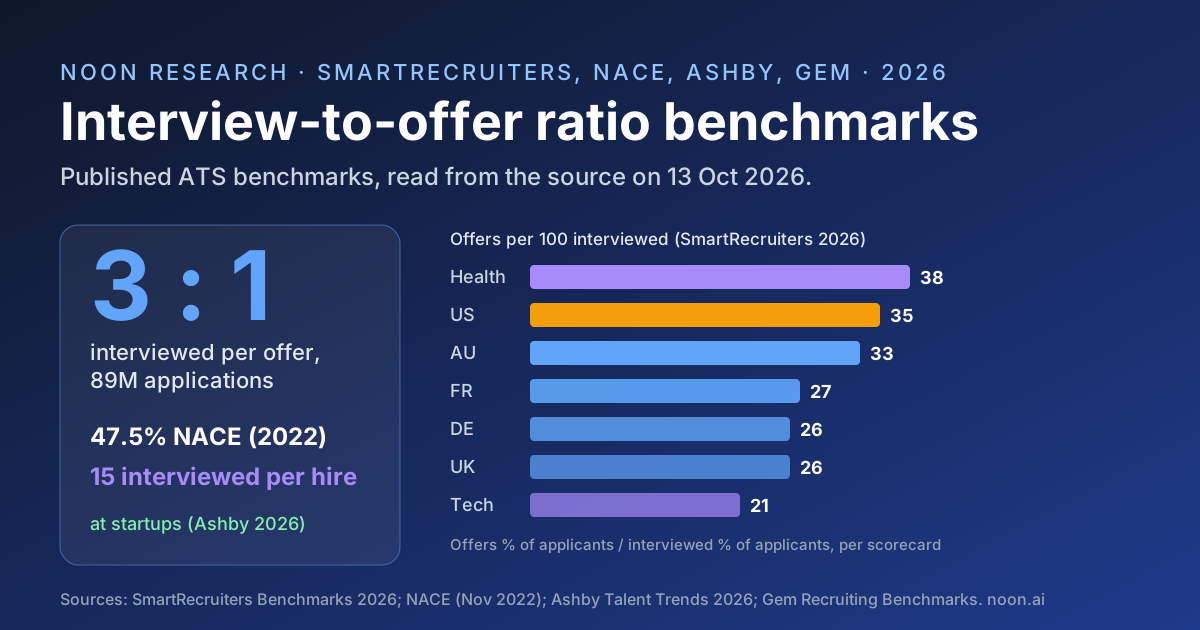
Key takeaway: About 1 in 3 interviewed candidates gets an offer. SmartRecruiters' 2026 benchmarks, built on 89 million applications, count 3 applicants interviewed for every 1 offer made, an interview-to-offer ratio of 3:1 (about 33%). US employers convert about 35 of every 100 candidates they interview into offers, technology employers about 21. NACE's employer benchmark is looser at 47.5%, roughly 2 candidates interviewed per offer.
Interview-to-offer ratio measures how many candidates a team interviews before it makes one offer. It is the clearest single check on screening quality: every extra interview per offer is recruiter, hiring manager and candidate time spent on someone the team was never going to hire.
The trend is moving the wrong way. Gem's 2025 Recruiting Benchmarks report found hiring teams "conduct 42% more interviews per hire than in 2021 (20 vs. 14)", and Ashby's State of Startup Hiring 2026 report counts 15 applicants interviewed for every startup hire.
All figures below are third-party benchmarks from applicant tracking system (ATS) vendors and an employer association, attributed to each publisher. None of them are Noon data.
What is a good interview-to-offer ratio in 2026?
A ratio near 3:1, meaning roughly one offer for every three candidates interviewed, is the current cross-industry benchmark. A team at 2:1 is screening tightly; a team at 5:1 or above is interviewing more people than its offer rate can justify, unless it hires mostly technical roles.
| Source | Benchmark | Ratio | Data window | Sample |
|---|---|---|---|---|
| SmartRecruiters Benchmarks 2026, global | 3 interviewed, 1 offer | 3:1 (about 33%) | September 2023 to August 2024 | 89M applications, 1.5M jobs, 95 countries |
| SmartRecruiters 2026, United States | 4.3% interviewed, 1.5% offered | 2.9:1 (about 35%) | September 2023 to August 2024 | US scorecard |
| NACE, employer benchmark | 47.5% of interviewed get offers | 2.1:1 | Published November 29, 2022 | NACE employer members |
| Ashby Talent Trends, startups | 15 applicants interviewed per hire | 15:1 (interview to hire) | Published February 23, 2026 | 1,200+ startups, 32K hires |
Two of these numbers measure different things. SmartRecruiters and NACE count candidates interviewed per offer. Ashby counts applicants interviewed per hire, so it also absorbs declined offers and should not be compared one for one. NACE's members recruit heavily from college campuses, which helps explain why its 47.5% rate sits well above the ATS figures.
How do you calculate interview-to-offer ratio?
NACE's formula is: interview-to-offer rate = (number of unique offers extended / total number of applicants interviewed) x 100. The ratio is the same calculation inverted: candidates interviewed divided by offers extended.
For example, a team that interviews 30 candidates and extends 10 offers has a 3:1 ratio, or a 33% interview-to-offer rate. Count each candidate once, however many rounds they sit, and count unique offers, not revised ones. Counting interview rounds instead of candidates produces a much larger number, which is why Gem's 20 interviews per hire is not comparable with a 3:1 candidate ratio. The same definitional care applies to every stage in our recruiting funnel benchmarks.
How does interview-to-offer ratio vary by country?
The US converts interviews into offers more often than any other country SmartRecruiters profiles. Dividing each 2026 scorecard's share of applicants receiving offers by its share interviewed gives:
| Country (SmartRecruiters 2026) | Applicants interviewed | Applicants receiving offers | Offers per 100 interviewed | Interviewed per offer |
|---|---|---|---|---|
| United States | 4.3% | 1.5% | 35 | 2.9 |
| Australia | 6.0% | 2.0% | 33 | 3.0 |
| France | 2.2% | 0.6% | 27 | 3.7 |
| Germany | 5.4% | 1.4% | 26 | 3.9 |
| United Kingdom | 4.3% | 1.1% | 26 | 3.9 |
US and UK employers interview the same 4.3% of applicants, yet US teams make offers to 1.5% against 1.1% in the UK. The UK needs about one more interview per offer. France interviews the smallest share of applicants (2.2%), which SmartRecruiters says makes it "the most competitive country to look for a job".
Which industries have the lowest interview-to-offer conversion?
Technology, by a wide margin. Its scorecard shows 3.4% of applicants interviewed and 0.7% receiving offers, about 21 offers per 100 candidates interviewed, or close to 5 interviews per offer.
| Industry (SmartRecruiters 2026) | Applicants per hire | Applicants interviewed | Applicants receiving offers | Offers per 100 interviewed |
|---|---|---|---|---|
| Healthcare | 40 | 5.3% | 2.0% | 38 |
| Hospitality | 117 | 1.8% | 0.6% | 33 |
| Manufacturing | 38 | 4.8% | 1.4% | 29 |
| Retail | 65 | 5.3% | 1.5% | 28 |
| Technology | 110 | 3.4% | 0.7% | 21 |
SmartRecruiters attributes the low odds in technology and hospitality to volume: "Due to the sheer volume of applications per role, workers in Technology and Hospitality have the least chance of receiving offers." Hospitality filters hard before the interview, so its post-interview conversion is healthy. Technology interviews a larger share and still converts the fewest. Healthcare sits at the top, which the report links to certification requirements that filter out unqualified applicants early. For the applicant volumes behind these figures, see how many applicants a job posting gets.
How many candidates are interviewed per hire?
Fifteen, at startups. Ashby's State of Startup Hiring 2026 report (February 23, 2026; over 1,200 venture-backed startups, 32K hires) found:
- 15 applicants receive an interview for every hire
- 18 for every technical hire
- 13 for every business hire
Technical hiring takes 5 more interviewed candidates per hire, about 38% more than business hiring, consistent with SmartRecruiters' low technology conversion. Heather Doshay, quoted in the report, reads the data as evidence that "more interviews don't lead to better outcomes".
Are hiring processes using more interviews per hire?
Yes. Gem's 2025 report, covering over 140 million applicants and 1.3 million hires from January 2021 to December 2024, measured 20 interviews per hire against 14 in 2021, a 42% increase that it ties to "a 24% increase in average time to hire (41 vs. 33 days)". Gem's 2026 report, on data from June 2021 to May 2025, puts the increase at 33% since 2021 and says "both technical and non-technical roles are seeing steep increases".
The two editions use different windows, so the size of the rise varies, but the direction does not. More interviews per hire means longer processes; see our time to hire benchmarks for the stage-by-stage effect.
How much interview time does each hire cost?
Ashby measures it directly. Smaller startups (under 25 employees) spend about 21 interviewer hours per technical hire, and larger startups (100 to 300) about 29. The hired candidate spends 2.5 to 3 hours interviewing. Those hours count only scheduled interviews, not take-home assignments.
Multiply interviewer hours by loaded salary and the interview stage becomes one of the larger internal line items in cost per hire. Lowering the ratio from 5:1 toward 3:1 cuts that cost without touching the offer itself.
What does a high interview-to-offer ratio tell you?
NACE puts it plainly: a dip in your offer rate "suggests that you are interviewing a greater number of candidates who do not meet your criteria than was the case previously." The fix is upstream of the interview, not inside it.
- Benchmark against your segment. A US technical team should compare itself to SmartRecruiters' technology figure (about 21 per 100) and Ashby's 18 interviewed per technical hire, not to a blended 3:1.
- Measure candidates, not rounds. Track candidates interviewed per offer and interview rounds per hire as two separate numbers.
- Tighten the pre-interview screen. Write must-have criteria before sourcing starts and screen against them; structured, job-related evaluation is also the most predictive interview format in the structured interview validity research.
- Watch the next conversion too. A low ratio that comes with frequent declines just moves the problem one stage down; check it against offer acceptance rate benchmarks.
- Review the ratio by source. If one channel fills interview slots with candidates who rarely reach an offer, shift effort to channels that do.
How Noon helps teams interview fewer, better-matched candidates
Most excess interviews come from weak matches reaching the interview stage. Noon's AI recruiting platform sources across the whole web, not just LinkedIn, and evaluates every candidate against the role's criteria and non-negotiables before anyone is contacted. Hiring-manager feedback calibrates the evaluation for each role, so the shortlist gets tighter as the search runs. Outreach goes out by email and SMS, and Noon's AI Interviewer can run a voice screening conversation before the team commits interviewer hours. Noon has a single plan with unlimited sourcing, enrichment, contacts, agents and seats; see Noon pricing for details.
Methodology and sources
- SmartRecruiters, Global Recruitment Benchmarks 2026 (PDF). Aggregated, anonymized ATS data from September 2023 through August 2024: 89 million applications for 1.5 million jobs in 95 countries. Source of the global "3 applicants interviewed, and only 1 offer made" figure and the country and industry scorecards.
- NACE, Calculating and Using Interview-to-Offer, Offer-to-Acceptance Rates (November 29, 2022). Source of the formula and the 47.5% interview-to-offer benchmark.
- Ashby, The State of Startup Hiring 2026 (February 23, 2026). Over 1,200 venture-backed startups, 32K hires and 11M applications. Source of interviewed-per-hire counts and interview hours.
- Gem, 10 takeaways from the 2025 Recruiting Benchmarks report (20 vs. 14 interviews per hire) and Key takeaways from the 2026 Recruiting Benchmarks report (33% increase since 2021).
Every source was fetched on 13 October 2026. Each figure's exact quote and fetch time is recorded in our research file for this article. A script checks every quote against the saved source text and computes the derived numbers: offers per 100 interviewed and interviewed per offer for each scorecard (offers share divided by interviewed share), NACE's 2.1 candidates per offer, and Ashby's 5-candidate, 38% technical gap.
Limitations
- The country and industry ratios are derived by dividing two percentages that SmartRecruiters rounds to one decimal place. Small shares (France and hospitality at 0.6% offers) carry the most rounding error, so read those ratios as approximate.
- Each vendor reports on its own customers, so none is a random sample of all employers. Ashby's data covers venture-backed startups only.
- Definitions differ. SmartRecruiters and NACE count candidates interviewed per offer, Ashby counts candidates interviewed per hire, and Gem counts interviews conducted per hire.
- NACE's 47.5% is from 2022 and reflects an employer population focused on early-career recruiting, so it is shown as a dated comparison.
- Gem's 2025 and 2026 editions report different increases (42% and 33%) over overlapping windows; the direction is consistent, the size is not.
FAQ
What is the average interview-to-offer ratio?
About 3:1. SmartRecruiters' 2026 benchmarks, based on 89 million applications, report 3 applicants interviewed for every offer made, an interview-to-offer rate of about 33%.
What is a good interview-to-offer ratio?
At or below 3:1 is in line with current ATS benchmarks. US employers average about 2.9 candidates interviewed per offer in SmartRecruiters' 2026 data; NACE's employer benchmark of 47.5% equals about 2.1.
How do you calculate the interview-to-offer ratio?
Divide the number of candidates interviewed by the number of unique offers extended. To express it as a rate, divide offers by candidates interviewed and multiply by 100, per NACE's formula.
Why is the interview-to-offer ratio higher for technical roles?
Technical roles draw more applicants and more interviews per hire. SmartRecruiters' technology scorecard converts about 21 of every 100 interviewed candidates into offers, and Ashby counts 18 applicants interviewed per technical hire against 13 for business roles.
How many interviews does it take to make a hire?
It depends on what you count. Gem's 2025 report measured 20 interviews conducted per hire, up from 14 in 2021, while Ashby counts 15 candidates interviewed per startup hire.