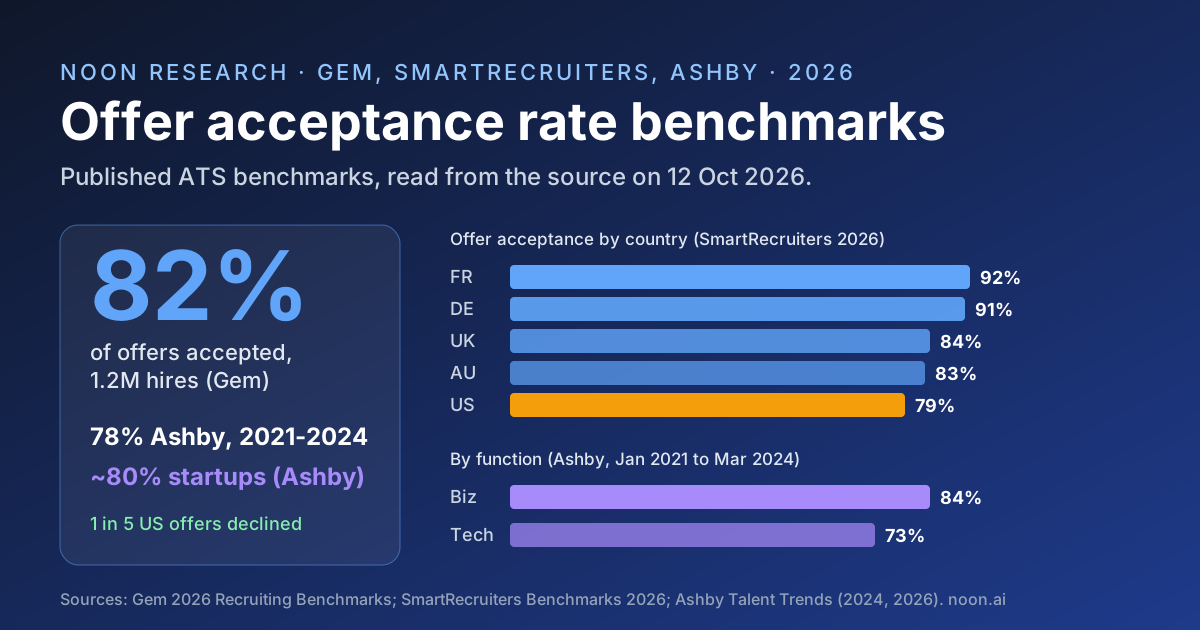
Key takeaway: About 82% of job offers are accepted, according to Gem's 2026 Recruiting Benchmarks report, built on data from 1.2 million hires between June 2021 and May 2025. Ashby lands close behind at 78% for January 2021 to March 2024 and about 80% for startups in 2026. Geography moves the number more than anything else: SmartRecruiters' 2026 benchmarks run from 79% in the US to 92% in France, which means roughly one in five US offers is turned down.
Offer acceptance rate is the last conversion in the hiring funnel and the most expensive one to lose. By the time a candidate declines, the team has already paid for sourcing, screening, interviews and the offer itself. The published benchmarks agree on the broad range, but they disagree enough on the exact figure that the choice of benchmark matters when you set a target.
All figures below are third-party benchmarks from applicant tracking system (ATS) vendors and an employer association, attributed to each publisher. None of them are Noon data.
What is a good offer acceptance rate in 2026?
Current ATS benchmarks cluster between 78% and 82%. Anything above that range is strong for a US team; anything in the low 70s is worth investigating, unless most of your hiring is technical.
| Source | Offer acceptance rate | Data window | Sample |
|---|---|---|---|
| Gem 2026 Recruiting Benchmarks | 82% | June 2021 to May 2025 | 165M+ applicants, 1.2M hires |
| Ashby Talent Trends, startups | About 80% | Published February 23, 2026 | 1,200+ venture-backed startups, 32K hires |
| Ashby Talent Trends, offer acceptance | 78% | January 2021 to March 2024 | 230K applications at the offer stage |
| SmartRecruiters Benchmarks 2026, US | 79% | September 2023 to August 2024 | 89M applications, 1.5M jobs, 95 countries |
| NACE, employer benchmark | 69.3% | Published November 29, 2022 | NACE employer members |
Gem's figure is the broadest current sample. Gem describes 82% as "the highest acceptance rate since 2021", even as only 0.5% of applicants ultimately receive offers, roughly one hire per 200 applications.
How do you calculate offer acceptance rate?
NACE gives the standard formula: offer acceptance rate = (number of offers accepted / number of offers extended) x 100.
The formula is simple; the inputs are not. Ashby notes that "some teams tend to create offers only after verbal acceptance", which pushes their recorded rate close to 100%. Ashby controls for this and for organization-based rejection reasons in its benchmark. If your ATS only logs offers after a verbal yes, compare your verbal offer outcomes to these benchmarks instead, or your number will look better than it is. The same definitional care applies to the rest of the recruiting funnel benchmarks.
Does offer acceptance rate vary by country?
Yes, by 13 percentage points across the five markets SmartRecruiters profiles. Its 2026 report, covering 89 million applications from September 2023 through August 2024, states that "the US has the lowest offer acceptance rate in the world at 79%".
| Country (SmartRecruiters 2026) | Offer acceptance rate |
|---|---|
| France | 92% |
| Germany | 91% |
| United Kingdom | 84% |
| Australia | 83% |
| United States | 79% |
SmartRecruiters draws the practical conclusion itself: "because one in five U.S. applicants decline offers", US employers "need to ensure a smooth hiring process so that silver medalist candidates are kept warm". At 79%, that is 21 declines for every 100 offers.
Which industries have the lowest offer acceptance rates?
Healthcare and technology, both at 77% in the SmartRecruiters 2026 industry scorecards. Manufacturing sits at 92% and hospitality at 84%, a 15-point spread across the four industries.
Ashby's narrower, tech-weighted dataset shows a similar order within its own customer base: Business Services 82%, Health Technology 80%, SaaS and Cloud 79%, Financial Technology 77%, Online Marketplaces 76%, Consumer Apps 73% and Media & Entertainment 72% (January 2021 to March 2024).
Do technical roles have lower offer acceptance rates?
Yes. Ashby found a 73% average offer acceptance rate for technical roles against 84% for business roles over three years, an 11 percentage point gap that it says held "even during layoff seasons". Ashby does not attribute the gap to a single cause, so treat it as a segment to benchmark separately rather than a problem to explain away. Technical roles also differ on speed; see our time to hire benchmarks.
Ashby's year-by-year series shows how much the market moves the number: 77% in 2021, 76% in 2022 and 81% in 2023, the highest year in its data. Gem's prior edition similarly reported 84% acceptance against 81% in 2021, describing "increased willingness to commit to new" roles.
Do remote roles get more offers accepted?
They do among startups. Ashby's State of Startup Hiring 2026 report (February 23, 2026) found "a 9% higher offer acceptance rate for remote roles over in-office roles". The effect is concentrated in technical hiring: remote technical roles show 13% higher acceptance and remote business roles 4% higher. For how many US postings offer remote work in the first place, see our remote job statistics.
Does time in the offer stage affect acceptance?
The data points to speed mattering. Ashby measured average time in the offer stage as stable at about 3 days until Q2 2023, when it dropped 16% to 2.5 days, in the year acceptance reached its 81% high. Ashby says this "likely reflects the eagerness of candidates to find a new role", so the timing is a signal of market conditions as much as a lever.
A long silence between final interview and offer is also where candidates drift away. Our candidate ghosting statistics cover how often candidates disappear late in the process.
What should recruiters do with these benchmarks?
- Benchmark against the right segment. A US technical team should compare itself to Ashby's 73% technical average and SmartRecruiters' 79% US rate, not to a blended 82%.
- Fix the definition first. Count every formal offer extended, including ones that follow a verbal decline, before comparing to an external figure.
- Track declines by reason. Compensation, a competing offer and process friction call for different fixes; a blended rate hides which one you have.
- Keep silver medalists warm. If roughly one in five US offers is declined, the second-choice candidate should still be engaged when the offer goes out.
- Price the decline. Each lost offer restarts sourcing and interviewing, which shows up directly in cost per hire.
How Noon helps teams reach the offer stage with more options
Offer declines hurt most when there is no second candidate ready. Noon's AI recruiting platform sources across the whole web, not just LinkedIn, evaluates candidates against the role's criteria and contacts them by email and SMS, so teams can reach the offer stage with more than one qualified finalist. The AI Scheduler books interviews and answers candidate questions automatically, so booking the next round does not wait on a recruiter's inbox. Noon has a single plan with unlimited sourcing, enrichment, contacts, agents and seats; see Noon pricing for details.
Methodology and sources
- Gem, Key takeaways from the 2026 Recruiting Benchmarks report. Data from June 2021 to May 2025 covering over 165 million applicants and 1.2 million hires. Source of the 82% acceptance rate and the 0.5% offer rate. Gem's 2025 edition (over 140 million applications and 1 million hires) is the source of the 84% and 81% comparison.
- SmartRecruiters, Global Recruitment Benchmarks 2026 (PDF). Aggregated, anonymized ATS data from September 2023 through August 2024: 89 million applications for 1.5 million jobs in 95 countries. Country and industry rates are from the report's scorecards.
- Ashby Talent Trends. Offer Acceptance Rates (June 6, 2024; 230K applications reaching the offer stage, January 2021 to March 2024) and The State of Startup Hiring 2026 (February 23, 2026; over 1,200 venture-backed startups, 32K hires and 11M applications).
- NACE, Calculating and Using Interview-to-Offer, Offer-to-Acceptance Rates (November 29, 2022). Source of the formula and the 69.3% employer benchmark.
Every source was fetched on 12 October 2026. Each figure's exact quote and fetch time is recorded in our research file for this article, and a script checks every quote against the saved source text and computes the derived numbers (the 13 and 15 point spreads, the 11 point role gap and the 21 declines per 100 US offers).
Limitations
- Each vendor reports on its own customers, so none is a random sample of all employers. Ashby's startup report covers venture-backed startups only, and SmartRecruiters says its customers range across more than 100 industries.
- The data windows differ and overlap only partly, so the sources should not be averaged. Gem's 2025 and 2026 editions also report different rates for overlapping years, which suggests single-point differences are within sample noise.
- Definitions differ. Ashby adjusts for teams that only log offers after verbal acceptance; the other sources do not describe an equivalent adjustment.
- NACE's 69.3% is from 2022 and comes from a different employer population, so it is shown as a dated comparison only.
- Ashby's remote figures are relative differences among startups and do not give the underlying remote and in-office rates.
FAQ
What is the average offer acceptance rate?
82%, per Gem's 2026 Recruiting Benchmarks report covering 1.2 million hires from June 2021 to May 2025. Ashby reports 78% for January 2021 to March 2024 and about 80% for startups in 2026.
What is a good offer acceptance rate for a US company?
SmartRecruiters' 2026 benchmarks put the US at 79%, the lowest of the countries it profiles. A US team at or above 80% is at or above that benchmark.
Is offer acceptance lower for technical roles?
Ashby's data shows 73% acceptance for technical roles against 84% for business roles over three years, a gap it says held even during layoff seasons. Ashby's startup data adds that remote technical roles see 13% higher acceptance than in-office ones.
How do you calculate offer acceptance rate?
Divide offers accepted by offers extended and multiply by 100, per NACE's formula. Count every formal offer, including those declined, and avoid logging offers only after a verbal yes.
Which country has the highest offer acceptance rate?
France, at 92% in SmartRecruiters' 2026 benchmarks, followed by Germany at 91%. The US is lowest at 79%.