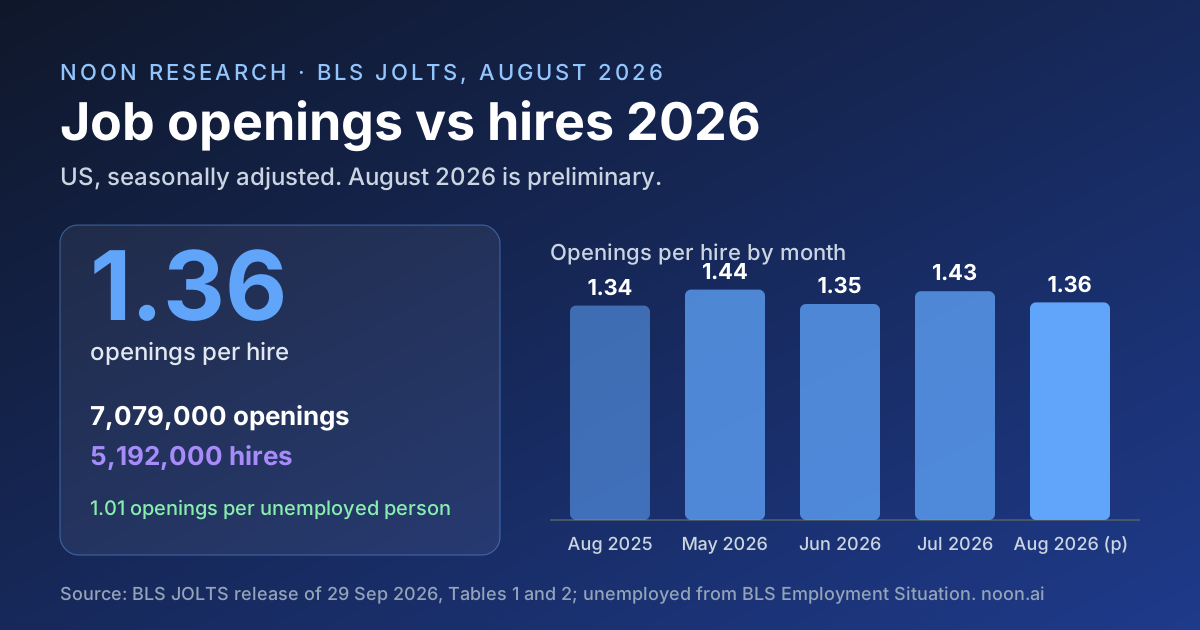
Key takeaway: There were 1.36 job openings for every hire in the US in August 2026. The Bureau of Labor Statistics' Job Openings and Labor Turnover Survey (JOLTS), released 29 September 2026, counted 7,079,000 job openings on the last business day of August and 5,192,000 hires during the month (seasonally adjusted, preliminary). That leaves a gap of 1.89 million openings over the month's hires. Openings were up 160,000 on August 2025 while hires rose 47,000, so the ratio edged up from 1.34 a year earlier. With 7,031,000 people unemployed in August, there was about one opening (1.01) per unemployed person.
The headline BLS sentence is short: "The number of job openings was little changed at 7.1 million in August," and "Hires changed little at 5.2 million." The job openings rate was 4.3% and the hires rate 3.3%. Quits held at 3.1 million, a 1.9% rate, which the BLS describes as a measure of "workers' willingness or ability to leave jobs" (BLS JOLTS news release, 29 September 2026).
Those totals hide wide spreads. Finance and insurance employers posted 3.21 openings for every hire in August, while construction posted 0.81. Employers with 5,000 or more staff had 2.96 openings per hire; those with 50 to 249 staff had 1.14. This page sets out the latest figures from the BLS tables we rendered on 6 October 2026, the ratios we computed from them, and what the numbers can and cannot tell a recruiting team.
For how long those openings take to close, see our time-to-hire benchmarks; for what each hire costs, the cost-per-hire benchmarks.
How many job openings vs hires were there in 2026?
Between 1.35 and 1.44 openings per hire in every month the current release covers, with August at 1.36. The table uses the BLS seasonally adjusted totals from Table 1 (openings) and Table 2 (hires). Levels are in thousands; August 2026 is preliminary.
| Month | Job openings | Hires | Openings per hire | Openings minus hires |
|---|---|---|---|---|
| August 2025 | 6,919 | 5,145 | 1.34 | 1,774 |
| May 2026 | 7,537 | 5,252 | 1.44 | 2,285 |
| June 2026 | 7,182 | 5,332 | 1.35 | 1,850 |
| July 2026 | 7,335 | 5,146 | 1.43 | 2,189 |
| August 2026 (p) | 7,079 | 5,192 | 1.36 | 1,887 |
Sources: JOLTS Table 1 and Table 2, rendered 6 October 2026. Ratios computed by Noon Research from the table values.
July's figures in this table are already revised. The BLS says "The number of job openings for July was revised up by 64,000 to 7.3 million, the number of hires was revised up by 92,000 to 5.1 million." August will be revised the same way when the September data come out, so treat the last row as a first estimate.
Which industries have the most job openings per hire?
Federal government (4.35), finance and insurance (3.21) and information (2.80) had the most openings per hire in August 2026; arts and entertainment (0.75) and construction (0.81) had the fewest. A ratio above 1 means openings at the end of the month outnumbered the hires made during it. Below 1, the industry hired more people in the month than it had openings left at month end.
| Industry | Job openings (thousands) | Hires (thousands) | Openings per hire, Aug 2026 | Openings per hire, Aug 2025 |
|---|---|---|---|---|
| Federal government | 113 | 26 | 4.35 | 3.09 |
| Finance and insurance | 353 | 110 | 3.21 | 1.77 |
| Information | 123 | 44 | 2.80 | 2.04 |
| Health care and social assistance | 1,359 | 703 | 1.93 | 1.92 |
| State and local government | 618 | 320 | 1.93 | 2.40 |
| Manufacturing | 522 | 332 | 1.57 | 1.39 |
| Transportation, warehousing, and utilities | 338 | 247 | 1.37 | 1.31 |
| Professional and business services | 1,186 | 935 | 1.27 | 1.06 |
| Retail trade | 761 | 667 | 1.14 | 1.08 |
| Wholesale trade | 188 | 171 | 1.10 | 1.48 |
| Other services | 238 | 238 | 1.00 | 1.42 |
| Accommodation and food services | 713 | 750 | 0.95 | 1.21 |
| Real estate and rental and leasing | 50 | 54 | 0.93 | 1.57 |
| Construction | 251 | 308 | 0.81 | 0.63 |
| Arts, entertainment, and recreation | 116 | 155 | 0.75 | 0.66 |
Sources: JOLTS Table 1 and Table 2, seasonally adjusted, rendered 6 October 2026.
Two patterns stand out. White-collar sectors carry the highest ratios: finance and insurance had a 5.0% openings rate but a 1.7% hires rate, and information a 4.3% openings rate against a 1.6% hires rate. High-turnover sectors sit near or below 1: leisure and hospitality had a 5.3% hires rate, higher than its 4.7% openings rate.
Finance and insurance also moved the most in a year, from 1.77 openings per hire in August 2025 to 3.21, as openings rose from 242,000 to 353,000 and hires fell from 137,000 to 110,000. The federal figure rests on small counts (113,000 openings, 26,000 hires), so a modest change in either moves the ratio a lot.
Do large employers have more open jobs per hire?
Yes, by a wide margin in August 2026: 2.96 openings per hire at private employers with 5,000 or more staff, against 1.14 at those with 50 to 249. BLS Table 7 splits private-sector openings and hires by establishment size.
| Establishment size | Job openings (thousands) | Hires (thousands) | Openings per hire |
|---|---|---|---|
| 1 to 9 employees | 1,050 | 702 | 1.50 |
| 10 to 49 employees | 1,961 | 1,663 | 1.18 |
| 50 to 249 employees | 1,765 | 1,549 | 1.14 |
| 250 to 999 employees | 823 | 602 | 1.37 |
| 1,000 to 4,999 employees | 506 | 248 | 2.04 |
| 5,000 or more employees | 243 | 82 | 2.96 |
| All private | 6,348 | 4,846 | 1.31 |
Source: JOLTS Table 7, seasonally adjusted, rendered 6 October 2026.
The large-employer ratios are driven by hires rates as much as openings rates. Establishments with 5,000 or more employees had a 5.2% openings rate and a 1.9% hires rate. The smallest establishments moved the other way in August: the BLS notes that "the job openings rate decreased for establishments with 1 to 9 employees," from 6.0% in July to 4.3%. Size class here is the size of the establishment (a single location), not of the whole company.
How many job openings are there per unemployed person?
About one: 7,079,000 openings against 7,031,000 unemployed people in August 2026, a ratio of 1.01. The unemployment count comes from a different BLS survey, the household survey in the Employment Situation release, which reported 7,031,000 unemployed in August and 7,109,000 in September, with a 4.2% unemployment rate for September (Employment Situation Table A, rendered 6 October 2026).
A ratio near 1 does not mean every unemployed person could fill an open job. Openings and job seekers differ by location, skills and pay, and many hires come from people who already have a job. It is a rough read on how tight the market is overall, and it is the comparison most often quoted next to the JOLTS headline.
What does the openings-to-hires gap mean for recruiters?
It is a market-level signal, not a forecast for any one requisition. JOLTS openings are a snapshot on one day; hires are a count over a whole month. The ratio between them is not a measure of how many jobs went unfilled, and a role can be open on the last day of August and filled on the first day of September. With that caution, three practical reads hold up:
- Benchmark your own sector, not the national number. A finance or information recruiter working against 3.21 or 2.80 openings per hire is in a very different market from a hospitality recruiter at 0.92. If your team's time to fill is long, compare it to your sector's ratio before blaming the process. Our guide to hard-to-fill roles covers what to change when the market is the constraint.
- Large employers carry the most open roles per hire. At 2.96 openings per hire, establishments of 5,000 or more staff carry about three open roles for each hire they make in a month, the highest of any size class in the August data.
- Not every posted opening is a JOLTS opening. The BLS counts a position only if "a specific position exists" and "The job could start within 30 days." Postings for pipelines or future roles fall outside that definition, which is one reason job-board counts and JOLTS do not match. Our ghost jobs report covers the postings that are never meant to be filled.
For broader context on the 2026 market, see our tech job market 2026 roundup and the recruitment statistics 2026 reference page.
How does Noon help teams with more openings than hires?
When openings outnumber hires, the work that stretches is sourcing and first contact: finding enough qualified people and reaching them before another employer does. Noon's AI Sourcer searches the whole web for candidates, not just LinkedIn, and evaluates each against the role's criteria. AI Outreach then runs personalized email and SMS sequences and hands interested candidates to scheduling.
Noon is sold as one plan with unlimited sourcing, unlimited email enrichment, unlimited contacts, unlimited agents and unlimited seats, so adding open roles does not add seat or credit costs. The plan is quote-based; see Noon pricing for what is included.
When is the next JOLTS release?
Tuesday, 3 November 2026, at 10:00 a.m. ET, covering September 2026. The BLS states: "The Job Openings and Labor Turnover news release for September 2026 is scheduled to be published on Tuesday, November 3, 2026, at 10:00 a.m." That release will also revise the August figures on this page. We will update the tables when it is out.
Methodology and sources
Methodology. On 6 October 2026 we rendered the BLS JOLTS news release for August 2026 (published 29 September 2026), its Table A, Tables 1, 2, 4 and 7, and the technical note, plus the Employment Situation release for September 2026 and its Table A, in Chrome through Playwright over CDP. Table cells were captured exactly as rendered and stored with their URLs and fetch times in this article's research record. All levels are seasonally adjusted and in thousands. Openings per hire is job openings divided by hires for the same month, rounded to two decimals; openings per unemployed person is August 2026 JOLTS openings divided by the August 2026 household-survey unemployment level. The ratios are our arithmetic on BLS figures, not BLS statistics. Demand check: DataForSEO measured 880 monthly US searches for "jolts job openings" on the same date.
How JOLTS is collected. In the BLS technical note's words, "The JOLTS survey design is a stratified random sample of approximately 21,000 nonfarm business and government establishments." "Job openings include all positions that are open on the last business day of the reference month," while hires count everyone added to the payroll during the month (JOLTS technical note).
Limitations. August 2026 figures are preliminary and will be revised. JOLTS measures openings at one point in time and hires over a month, so the ratio compares a stock with a flow and should not be read as a fill rate. Industry and size-class estimates come from a sample and carry sampling error; the smallest cells (federal government, real estate, mining) can swing month to month. Size class refers to establishments, not firms. JOLTS does not break openings down by occupation, so it cannot say which roles are hardest to fill. Noon sells recruiting software, and the section on Noon describes our own product, not an independent comparison.
FAQ
How many job openings are there in the US right now?
7,079,000 on the last business day of August 2026, according to the BLS JOLTS release published 29 September 2026. That figure is seasonally adjusted and preliminary. The September 2026 figure is due on 3 November 2026.
What is the ratio of job openings to hires?
1.36 openings per hire in August 2026: 7,079,000 openings against 5,192,000 hires. It was 1.34 in August 2025 and 1.43 in July 2026.
Are there more job openings than unemployed people in 2026?
Narrowly. In August 2026 there were 7,079,000 openings and 7,031,000 unemployed people, about 1.01 openings per unemployed person.
Which industry has the most job openings per hire?
Among the industries in the BLS tables, federal government had the highest ratio in August 2026 at 4.35, followed by finance and insurance at 3.21 and information at 2.80. Construction (0.81) and arts, entertainment and recreation (0.75) had the lowest.
What is the difference between JOLTS openings and job postings?
JOLTS counts a position as open only if it exists, work is available, the job could start within 30 days, and the employer is actively recruiting from outside the establishment. Job-board counts include postings that may not meet those tests, so the two numbers differ.