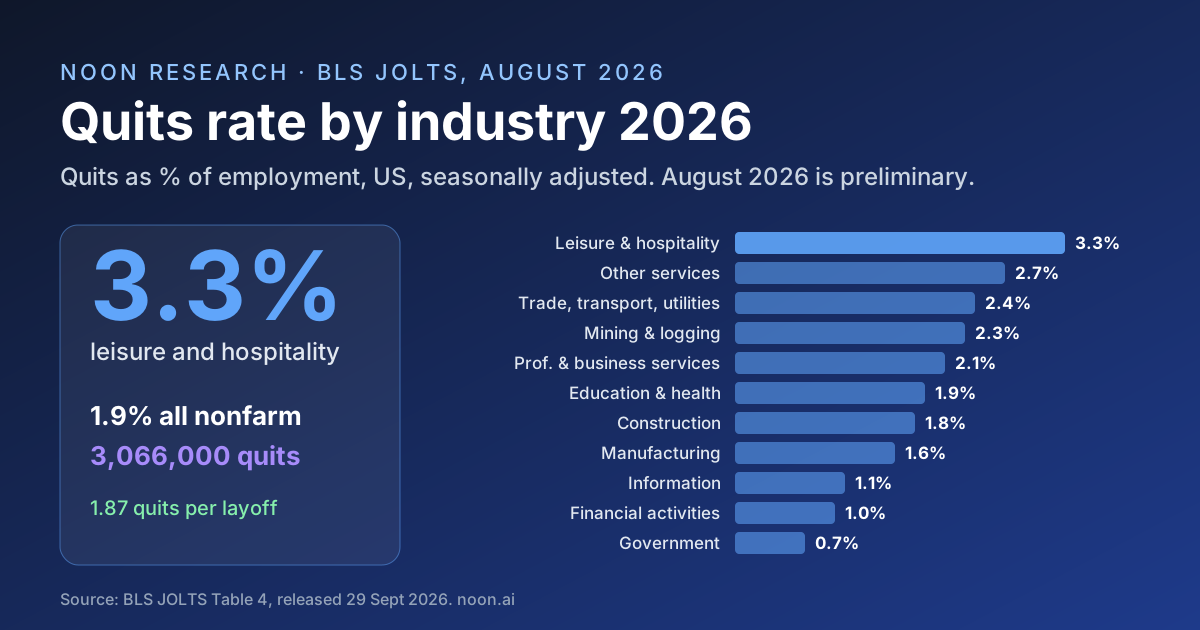
Key takeaway: Leisure and hospitality had the highest quits rate of any major US industry in August 2026, at 3.3%, against 1.9% for all nonfarm jobs. The Bureau of Labor Statistics' Job Openings and Labor Turnover Survey (JOLTS), released 29 September 2026, counted 3,066,000 quits in August (seasonally adjusted, preliminary). Accommodation and food services posted the highest rate of any industry row at 3.5%, followed by retail trade at 3.0%. The lowest were government (0.7%, federal 0.5%), financial activities (1.0%) and information (1.1%). The national rate is down from 2.0% in August 2025 and well below the 3.0% peak of November 2021 and April 2022.
The BLS defines the measure plainly: "Quits are generally voluntary separations initiated by the employee. Therefore, the quits rate can serve as a measure of workers' willingness or ability to leave jobs." The rate is "the number of quits during the entire month as a percent of employment" (BLS JOLTS Table 4, August 2026).
In August, quits outnumbered layoffs and discharges by 1.87 to 1 (3,066,000 against 1,641,000), up from 1.69 to 1 a year earlier, so voluntary exits still clearly outnumber involuntary ones. The BLS summary: "The number and rate of quits were unchanged at 3.1 million and 1.9 percent, respectively, over the month" (BLS JOLTS news release, 29 September 2026).
This page sets out every industry, region and employer-size quits rate in the current release, from the BLS tables we rendered on 7 October 2026, with the year-on-year change and the quits-to-layoffs ratio we computed from them. For the hiring side of the same release, see our JOLTS job openings vs hires 2026 page.
What is the quits rate by industry in 2026?
Between 0.7% (government) and 3.3% (leisure and hospitality) across the eleven BLS supersectors in August 2026. Rates are quits during the month as a percent of employment, seasonally adjusted. August 2026 is preliminary; levels are in thousands.
| Industry | Quits rate, Aug 2026 | Quits rate, Aug 2025 | Change (pts) | Quits, Aug 2026 (thousands) | Quits per layoff, Aug 2026 |
|---|---|---|---|---|---|
| Leisure and hospitality | 3.3% | 3.5% | -0.2 | 567 | 2.21 |
| Other services | 2.7% | 2.0% | +0.7 | 164 | 2.48 |
| Trade, transportation, and utilities | 2.4% | 2.1% | +0.3 | 682 | 2.04 |
| Mining and logging | 2.3% | 2.1% | +0.2 | 14 | 2.33 |
| Professional and business services | 2.1% | 2.5% | -0.4 | 467 | 1.20 |
| Private education and health services | 1.9% | 2.1% | -0.2 | 533 | 2.30 |
| Construction | 1.8% | 1.8% | 0.0 | 152 | 1.54 |
| Manufacturing | 1.6% | 1.3% | +0.3 | 197 | 2.07 |
| Information | 1.1% | 1.2% | -0.1 | 30 | 1.07 |
| Financial activities | 1.0% | 1.3% | -0.3 | 87 | 1.47 |
| Government | 0.7% | 0.8% | -0.1 | 172 | 2.32 |
| Total nonfarm | 1.9% | 2.0% | -0.1 | 3,066 | 1.87 |
Sources: JOLTS Table 4 (quits) and Table 5 (layoffs and discharges), rendered 7 October 2026. Changes and quits-per-layoff ratios computed by Noon Research from the table values.
Which industries have the highest quits rate?
Accommodation and food services (3.5%), retail trade (3.0%) and other services (2.7%). These are the industry rows below the supersector level, where the spread is widest:
| Industry (detail) | Quits rate, Aug 2026 | Quits rate, Aug 2025 | Change (pts) |
|---|---|---|---|
| Accommodation and food services | 3.5% | 3.9% | -0.4 |
| Retail trade | 3.0% | 2.4% | +0.6 |
| Arts, entertainment, and recreation | 2.3% | 1.1% | +1.2 |
| Health care and social assistance | 2.0% | 2.2% | -0.2 |
| Nondurable goods manufacturing | 2.0% | 1.5% | +0.5 |
| Transportation, warehousing, and utilities | 1.9% | 2.0% | -0.1 |
| Private educational services | 1.6% | 1.5% | +0.1 |
Accommodation and food services is the top row even after a year-on-year fall: its 507,000 quits in August were about one in six (16.5%) of all quits in the economy. Retail is the bigger mover, up 0.6 points to 3.0%. Health care and social assistance sits at 2.0%, close to the national figure.
Which industries have the lowest quits rate?
Federal government (0.5%), state and local government education (0.7%) and real estate (0.9%). Among private industries, the lowest rates are in finance and insurance and information:
| Industry (detail) | Quits rate, Aug 2026 | Quits rate, Aug 2025 | Change (pts) |
|---|---|---|---|
| Federal government | 0.5% | 0.7% | -0.2 |
| State and local government education | 0.7% | 0.8% | -0.1 |
| State and local, excluding education | 0.8% | 0.8% | 0.0 |
| Real estate and rental and leasing | 0.9% | 1.6% | -0.7 |
| Finance and insurance | 1.0% | 1.2% | -0.2 |
| Information | 1.1% | 1.2% | -0.1 |
| Wholesale trade | 1.3% | 1.4% | -0.1 |
| Durable goods manufacturing | 1.3% | 1.1% | +0.2 |
A 1.0% monthly quits rate in finance and insurance means about one employee in a hundred left voluntarily in August, under a third of the 3.5% rate in accommodation and food services. Real estate posted the largest year-on-year fall of any industry row, from 1.6% to 0.9%.
Where did quits rise or fall the most over the past year?
Arts, entertainment and recreation (+1.2 points), other services (+0.7) and retail (+0.6) rose most; real estate (-0.7) and professional and business services (-0.4) fell most. Professional and business services recorded 467,000 quits in August 2026, 85,000 fewer than in August 2025.
Month to month the picture was flatter. The BLS notes: "Quits decreased in wholesale trade (-34,000) and in state and local government education (-21,000). Quits increased in nondurable goods manufacturing (+28,000) and in private educational services (+13,000)."
How do quits compare with layoffs by industry?
Quits outnumbered layoffs and discharges in every industry row except arts, entertainment and recreation (0.73 quits per layoff). The ratio shows whether separations in a sector are mostly employee-driven or employer-driven. Retail trade (2.92) and accommodation and food services (2.91) had the most quits per layoff. Information (1.07), wholesale trade (1.11) and professional and business services (1.20) had the fewest, meaning layoffs were close to quits in number. Nationally the ratio rose from 1.69 in August 2025 to 1.87, because layoffs fell (1,832,000 to 1,641,000) faster than quits (3,095,000 to 3,066,000).
Does the quits rate differ by region?
Yes: the South had the highest quits rate in August 2026 at 2.4%, the West the lowest at 1.3%.
| Region | Quits rate, Aug 2026 | Quits rate, Aug 2025 | Quits, Aug 2026 (thousands) |
|---|---|---|---|
| South | 2.4% | 2.2% | 1,422 |
| Midwest | 2.0% | 1.9% | 680 |
| Northeast | 1.7% | 1.4% | 470 |
| West | 1.3% | 2.0% | 494 |
The West is the outlier: quits there fell by 244,000 on the year and the rate dropped 0.7 points, while the other three regions rose. Regional estimates come from smaller samples than the national figure, so a single month's swing should be confirmed by the next release.
Does company size affect the quits rate?
Yes. Establishments with 10 to 49 employees had the highest quits rate (2.5%) and those with 5,000 or more the lowest (0.9%). The BLS publishes size-class data for the private sector only.
| Establishment size | Quits rate, Aug 2026 | Quits rate, Aug 2025 | Quits per layoff |
|---|---|---|---|
| 1 to 9 employees | 1.8% | 1.7% | 1.89 |
| 10 to 49 employees | 2.5% | 2.5% | 2.54 |
| 50 to 249 employees | 2.3% | 2.4% | 1.59 |
| 250 to 999 employees | 1.9% | 1.9% | 1.45 |
| 1,000 to 4,999 employees | 1.5% | 1.6% | 1.14 |
| 5,000 or more employees | 0.9% | 0.8% | 2.21 |
| Total private | 2.1% | 2.2% | 1.85 |
Source: JOLTS Table 7, rendered 7 October 2026. Above ten employees, the rate falls steadily as establishments get larger.
How does the 2026 quits rate compare with past years?
Lower than before the pandemic and well below the 2021 to 2022 peak. The total nonfarm quits rate ranged from 1.9% to 2.0% in every month of 2026 so far (January to August), at or below the bottom of its 2017 to 2019 range of 2.0% to 2.4%. In 2019 alone it ran between 2.3% and 2.4% each month. It fell to 1.5% in April 2020, the lowest month in the series we pulled, and peaked at 3.0% in November 2021 and again in April 2022. These figures come from the BLS public data series JTS000000000000000QUR (total nonfarm quits rate, seasonally adjusted), which we pulled for January 2017 to August 2026 on 7 October 2026.
What does the quits rate mean for recruiters?
It tells you how many people in a sector are moving on their own, which shapes both backfill volume and how hard candidates are to move. Three practical reads:
- High-quit sectors are a backfill problem. At 3.5% in accommodation and food services, about 1 in 29 employees left voluntarily in August alone. Recruiting there is a continuous pipeline job, and speed matters more than depth; our time-to-hire benchmarks and cost-per-hire benchmarks show what that volume costs.
- Low-quit sectors mean fewer active job seekers. In finance and insurance (1.0%) and information (1.1%), few employees are leaving by choice, so most qualified candidates are employed and not looking. That makes outbound sourcing the main channel; see our guide to passive sourcing and better shortlists.
- Large employers lose few people voluntarily. At 0.9% in establishments of 5,000 or more, people at the largest employers rarely quit in a given month, so poaching from them takes more persistent outreach. Our guide to filling hard-to-fill roles covers what to change when the market is the constraint.
How does Noon help when fewer candidates are quitting?
A falling quits rate means the people you want are less likely to apply, so the work moves to finding and reaching them first. Noon's AI Sourcer searches the whole web for candidates, not just LinkedIn, and evaluates each one against the role's criteria. AI Outreach then runs personalized email and SMS sequences and hands interested candidates to scheduling.
Noon is sold as one plan with unlimited sourcing, unlimited email enrichment, unlimited contacts, unlimited agents and unlimited seats, so contacting more passive candidates does not add seat or credit costs. The plan is quote-based; see Noon pricing for what is included.
When is the next JOLTS release?
Tuesday, 3 November 2026, at 10:00 a.m. ET, covering September 2026. The BLS states: "The Job Openings and Labor Turnover news release for September 2026 is scheduled to be published on Tuesday, November 3, 2026, at 10:00 a.m. (ET)." The October 2026 data follow on 1 December 2026. Each release also revises the prior month; for July 2026, "the number of quits was revised up by 33,000 to 3.1 million."
Methodology and sources
Methodology. On 7 October 2026 we rendered the BLS JOLTS news release for August 2026 (published 29 September 2026), Tables 4, 5 and 7, the technical note and the JOLTS release schedule in Chrome through Playwright over CDP, and stored the table cells exactly as rendered with their URLs and fetch times in this article's research record. The quits-rate history comes from the BLS public data API (series JTS000000000000000QUR, January 2017 to August 2026), fetched the same day. All figures are seasonally adjusted. Year-on-year changes compare August 2026 with August 2025 as published in the same tables. Quits per layoff is the quits level divided by the layoffs and discharges level for the same industry and month, rounded to two decimals; it is our arithmetic on BLS figures, not a BLS statistic. Demand check: DataForSEO measured 110 monthly US searches for "quits rate" on the same date.
How JOLTS is collected. In the BLS technical note's words, "The JOLTS survey design is a stratified random sample of approximately 21,000 nonfarm business and government establishments." "Quits include employees who left voluntarily, with the exception of retirements or transfers to other locations" (JOLTS technical note).
Limitations. August 2026 figures are preliminary and will be revised with the September release. JOLTS reports quits by industry, region and establishment size, not by occupation or seniority, so it cannot tell you the quits rate for software engineers or nurses specifically. Estimates come from a sample and carry sampling error; small cells such as mining and logging, information, arts and real estate can swing several tenths of a point in a month. Size class refers to establishments, not firms. Historical comparisons use the current, revised BLS series. Noon sells recruiting software, and the section on Noon describes our own product, not an independent comparison.
FAQ
What is the current US quits rate?
1.9% in August 2026, according to the BLS JOLTS release published 29 September 2026: 3,066,000 quits, seasonally adjusted and preliminary. It was 2.0% in August 2025. The September 2026 figure is due on 3 November 2026.
Which industry has the highest quits rate?
Leisure and hospitality, at 3.3% in August 2026. Within it, accommodation and food services had the highest rate of any industry the BLS reports, 3.5%. Retail trade was next at 3.0%.
Which industry has the lowest quits rate?
Government, at 0.7%, with the federal government at 0.5%. Among private industries, real estate (0.9%), finance and insurance (1.0%) and information (1.1%) had the lowest rates.
What is a normal quits rate?
From 2017 to 2019 the total nonfarm quits rate ran between 2.0% and 2.4% a month. It fell to 1.5% in April 2020, peaked at 3.0% in November 2021 and April 2022, and has been between 1.9% and 2.0% in every month of 2026 so far.
What is the difference between quits and layoffs?
Quits are voluntary separations initiated by the employee. Layoffs and discharges are involuntary separations initiated by the employer. In August 2026 there were 1.87 quits for every layoff or discharge in the US.